Linear Graphing Lg3 Form


What is the Linear Graphing Lg3
The Linear Graphing Lg3 is a structured approach to understanding and representing linear relationships through graphs and tables. This tool is essential for students and professionals alike, as it helps visualize data and identify patterns. By utilizing the Linear Graphing Lg3, users can effectively analyze the slope and y-intercept of linear equations derived from tabular data. This method not only enhances comprehension but also aids in practical applications across various fields, including mathematics, engineering, and economics.
How to use the Linear Graphing Lg3
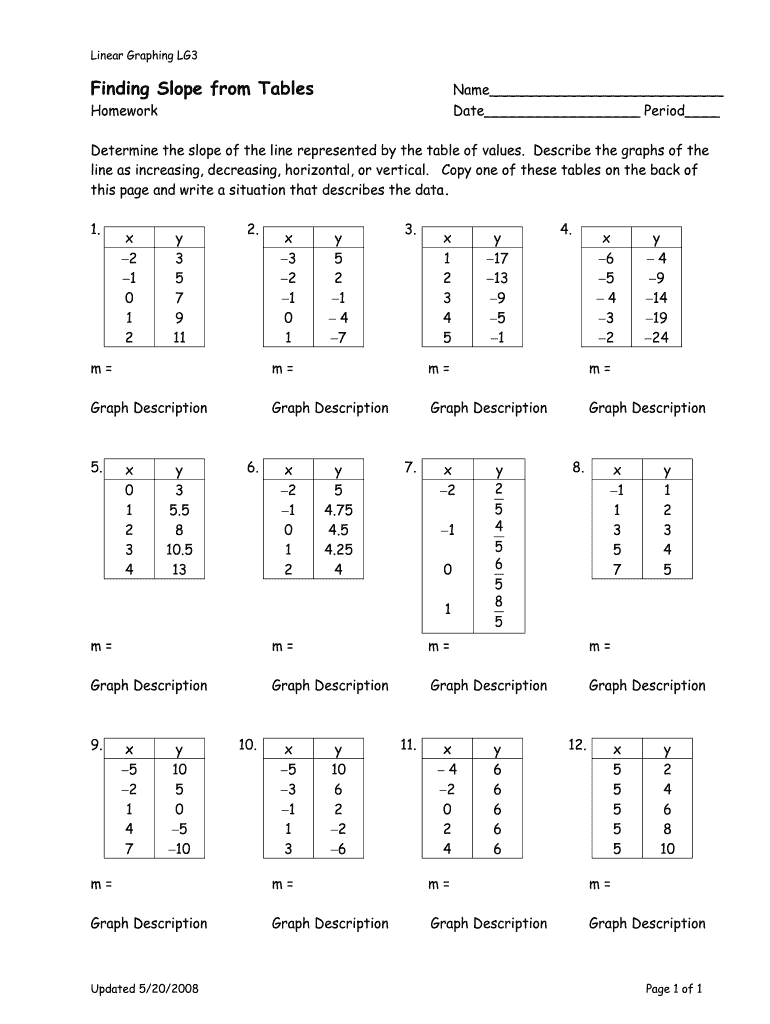
To effectively use the Linear Graphing Lg3, begin by gathering your data in a table format. Each row should represent a unique data point, with one column for the x-values and another for the y-values. Once your data is organized, plot these points on a graph to visualize the relationship. From here, you can determine the slope by selecting two points on the line, using the formula: slope = (y2 - y1) / (x2 - x1). This process not only simplifies the understanding of linear relationships but also facilitates the identification of trends and predictions.
Steps to complete the Linear Graphing Lg3
Completing the Linear Graphing Lg3 involves several straightforward steps:
- Collect data and organize it into a table format.
- Plot the data points on a Cartesian coordinate system.
- Select two points on the line to calculate the slope.
- Use the slope formula to find the slope value.
- Identify the y-intercept where the line crosses the y-axis.
- Draw the line through the plotted points to visualize the linear relationship.
Key elements of the Linear Graphing Lg3
The key elements of the Linear Graphing Lg3 include the coordinate system, data points, slope, and y-intercept. The coordinate system provides a framework for plotting points, while data points represent the values being analyzed. The slope indicates the steepness of the line, revealing how y changes with respect to x. The y-intercept is crucial as it shows the value of y when x equals zero, offering insights into the relationship between the variables. Understanding these components is vital for accurate graphing and analysis.
Examples of using the Linear Graphing Lg3
Practical examples of using the Linear Graphing Lg3 can be found in various scenarios. For instance, in a business context, a company might use this tool to analyze sales data over time, plotting monthly sales figures against time to identify trends. In an academic setting, students may apply this method to determine the relationship between study hours and exam scores, allowing them to visualize how increased study time correlates with improved performance. These examples illustrate the versatility and applicability of the Linear Graphing Lg3 in real-world situations.
Legal use of the Linear Graphing Lg3
The legal use of the Linear Graphing Lg3 pertains to its application in educational and professional settings where data representation is required. Ensuring accuracy and clarity in data presentation is essential to avoid misinterpretation, which can have legal implications, especially in fields such as finance and research. Utilizing this graphing method correctly can support compliance with industry standards and enhance the validity of the data being presented.
Quick guide on how to complete linear graphing lg3
Complete Linear Graphing Lg3 effortlessly on any device
Online document management has gained popularity among businesses and individuals. It offers a perfect eco-friendly substitute for traditional printed and signed documents, allowing you to obtain the necessary form and securely store it online. airSlate SignNow equips you with all the resources you need to create, modify, and eSign your documents quickly without delays. Handle Linear Graphing Lg3 on any device using airSlate SignNow's Android or iOS applications and simplify any document-driven process today.
How to edit and eSign Linear Graphing Lg3 with ease
- Locate Linear Graphing Lg3 and then click Get Form to begin.
- Utilize the tools we provide to complete your form.
- Highlight important sections of the documents or obscure sensitive information with tools that airSlate SignNow provides specifically for that purpose.
- Create your eSignature using the Sign tool, which takes mere seconds and carries the same legal validity as a conventional wet ink signature.
- Verify all the information and then click the Done button to save your modifications.
- Choose how you want to send your form, via email, SMS, invitation link, or download it to your computer.
Eliminate concerns about lost or misplaced documents, tedious searches for forms, or mistakes that necessitate printing new document copies. airSlate SignNow addresses your document management needs in just a few clicks from a device of your choice. Edit and eSign Linear Graphing Lg3 and ensure outstanding communication at every stage of your form preparation process with airSlate SignNow.
Create this form in 5 minutes or less
Create this form in 5 minutes!
How to create an eSignature for the linear graphing lg3
The way to create an e-signature for a PDF file online
The way to create an e-signature for a PDF file in Google Chrome
The best way to create an electronic signature for signing PDFs in Gmail
The way to make an electronic signature from your mobile device
The best way to generate an e-signature for a PDF file on iOS
The way to make an electronic signature for a PDF file on Android devices
People also ask
-
What is linear graphing lg3 finding slope from tables?
Linear graphing lg3 finding slope from tables is a method used to determine the slope of a line by analyzing data sets presented in table format. This process involves calculating the change in the y-values over the change in the x-values, providing a visual representation of linear relationships.
-
How can airSlate SignNow assist with linear graphing lg3 finding slope from tables?
AirSlate SignNow offers a user-friendly platform that simplifies the creation of tables and documents related to linear graphing lg3 finding slope from tables. You can easily edit and share your findings, making collaboration more efficient which is crucial when working with data sets.
-
Is there a cost associated with using airSlate SignNow for linear graphing lg3 finding slope from tables?
Yes, airSlate SignNow provides various pricing plans to cater to different business needs, including features that enhance the linear graphing lg3 finding slope from tables process. You can choose a plan that fits your budget while still offering essential tools for eSigning and document management.
-
What features does airSlate SignNow include for supporting linear graphing lg3 finding slope from tables?
AirSlate SignNow includes features like document templates, real-time collaboration, and advanced eSignature options that facilitate efficient handling of the data necessary for linear graphing lg3 finding slope from tables. These tools ensure you can work seamlessly and securely with your data.
-
Are there any integrations available with airSlate SignNow that can help with linear graphing lg3 finding slope from tables?
Absolutely! AirSlate SignNow integrates with popular tools like Google Drive and Microsoft Office, which enhance your ability to manage and analyze data for linear graphing lg3 finding slope from tables. These integrations streamline the workflow and boost productivity.
-
Can I track the progress of documents related to linear graphing lg3 finding slope from tables?
Yes, airSlate SignNow allows you to track the status of your documents, including those involved in linear graphing lg3 finding slope from tables. This feature helps you stay informed about who has viewed or signed documents, ensuring a smooth collaboration process.
-
What are the benefits of using airSlate SignNow for linear graphing lg3 finding slope from tables?
Using airSlate SignNow for linear graphing lg3 finding slope from tables provides a cost-effective solution that enhances efficiency. The ease of sending documents for eSignature and the ability to work with tables makes it an invaluable tool for businesses looking to simplify their data analysis.
Get more for Linear Graphing Lg3
- Superior court of washington for thurston county no state form
- Declaration of non surrender form
- Order to release weapons form
- A motion for an order to release weapons was filed form
- Courtcomattorney ampampamp court information
- Notice of hearing respondent form
- Court of washington no order for protection respondent form
- Motion to transfer case to form
Find out other Linear Graphing Lg3
- eSignature Massachusetts Insurance Lease Termination Letter Free
- eSignature Nebraska High Tech Rental Application Now
- How Do I eSignature Mississippi Insurance Separation Agreement
- Help Me With eSignature Missouri Insurance Profit And Loss Statement
- eSignature New Hampshire High Tech Lease Agreement Template Mobile
- eSignature Montana Insurance Lease Agreement Template Online
- eSignature New Hampshire High Tech Lease Agreement Template Free
- How To eSignature Montana Insurance Emergency Contact Form
- eSignature New Jersey High Tech Executive Summary Template Free
- eSignature Oklahoma Insurance Warranty Deed Safe
- eSignature Pennsylvania High Tech Bill Of Lading Safe
- eSignature Washington Insurance Work Order Fast
- eSignature Utah High Tech Warranty Deed Free
- How Do I eSignature Utah High Tech Warranty Deed
- eSignature Arkansas Legal Affidavit Of Heirship Fast
- Help Me With eSignature Colorado Legal Cease And Desist Letter
- How To eSignature Connecticut Legal LLC Operating Agreement
- eSignature Connecticut Legal Residential Lease Agreement Mobile
- eSignature West Virginia High Tech Lease Agreement Template Myself
- How To eSignature Delaware Legal Residential Lease Agreement