Sieve Analysis Graph Excel Download Form


What is the sieve analysis graph excel download
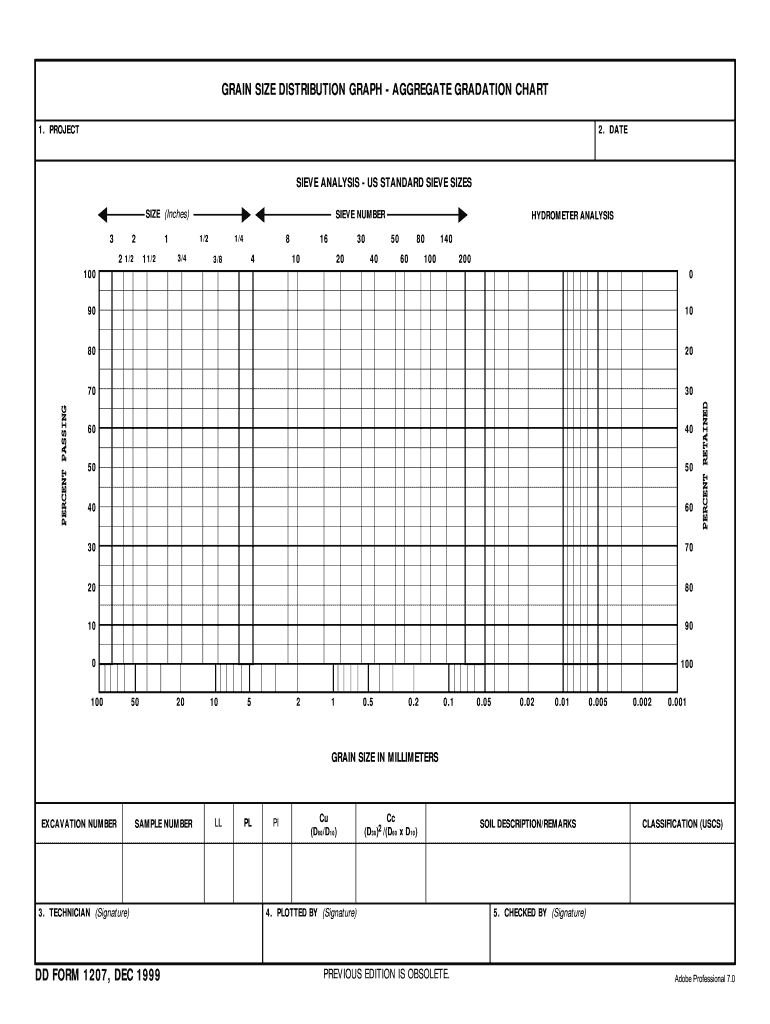
The sieve analysis graph excel download is a digital tool designed to assist in the analysis of particle size distribution in various materials. This tool allows users to create a graphical representation of sieve analysis results, which is essential in fields such as construction, mining, and environmental science. The graph visually displays how different particle sizes are distributed across a range of sieves, making it easier to interpret data and draw conclusions. By utilizing an excel format, users can easily input their data, customize their graphs, and perform calculations efficiently.
How to use the sieve analysis graph excel download
Using the sieve analysis graph excel download involves several straightforward steps. First, download the template from a reliable source. Open the file in Microsoft Excel, where you will find pre-set columns for entering your data, including sieve sizes and corresponding weights. Input your data accurately to ensure the graph reflects the correct distribution. Once your data is entered, use Excel's graphing tools to create the sieve analysis graph. This visual representation will help you analyze the particle size distribution effectively.
Steps to complete the sieve analysis graph excel download
To complete the sieve analysis graph excel download, follow these steps:
- Download the sieve analysis graph template in Excel format.
- Open the template in Microsoft Excel.
- Input your sieve sizes in one column and their corresponding weights in another.
- Calculate the cumulative weight and percentage passing for each sieve.
- Select the data range and insert a scatter plot or line graph to visualize the results.
- Customize the graph by adding titles, labels, and legends as necessary.
Legal use of the sieve analysis graph excel download
The sieve analysis graph excel download can be used legally in various contexts, provided that the data entered is accurate and complies with industry standards. For instance, in construction projects, accurate particle size distribution is critical for material selection and quality control. When using this tool, ensure that all data is collected following proper testing methods and that the final graph is used to support compliance with relevant regulations and standards in your field.
Key elements of the sieve analysis graph excel download
Key elements of the sieve analysis graph excel download include:
- Sieve Sizes: The specific sizes of the sieves used in the analysis.
- Weights: The weight of material retained on each sieve.
- Cumulative Weight: The total weight of material retained up to each sieve.
- Percentage Passing: The percentage of material that passes through each sieve, calculated based on the total weight.
- Graphical Representation: A visual plot that illustrates the particle size distribution.
Examples of using the sieve analysis graph excel download
Examples of using the sieve analysis graph excel download include:
- In construction, to determine the suitability of aggregates for concrete mixes.
- In environmental studies, to analyze soil samples for contamination assessment.
- In mining, to evaluate the quality of extracted materials based on their particle size distribution.
Quick guide on how to complete sieve analysis graph pdf form
Complete Sieve Analysis Graph Excel Download seamlessly on any device
Online document management has gained traction among companies and individuals. It offers an ideal environmentally friendly substitute for conventional printed and signed paperwork, as you can easily locate the necessary form and securely store it online. airSlate SignNow provides all the resources you require to prepare, modify, and eSign your documents promptly without delays. Manage Sieve Analysis Graph Excel Download on any platform using airSlate SignNow's Android or iOS applications and enhance any document-driven procedure today.
How to modify and eSign Sieve Analysis Graph Excel Download effortlessly
- Locate Sieve Analysis Graph Excel Download and click Get Form to begin.
- Employ the tools available to finalize your document.
- Emphasize essential sections of the documents or obscure sensitive information with tools that airSlate SignNow offers specifically for that purpose.
- Create your signature using the Sign feature, which takes mere seconds and holds the same legal validity as a conventional wet ink signature.
- Review the details carefully and click on the Done button to save your modifications.
- Select your preferred method of delivering your form, such as email, SMS, or invite link, or download it to your computer.
Leave behind lost or misplaced documents, tedious form searching, or errors that necessitate printing new document copies. airSlate SignNow addresses your document management needs in just a few clicks from any chosen device. Edit and eSign Sieve Analysis Graph Excel Download and ensure excellent communication at any stage of the form preparation process with airSlate SignNow.
Create this form in 5 minutes or less
FAQs
-
How do I fill a form which is PDF?
You can try out Fill which had a free forever plan and requires no download. You simply upload your PDF and then fill it in within the browser:UploadFillDownloadIf the fields are live, as in the example above, simply fill them in. If the fields are not live you can drag on the fields to complete it quickly. Once you have completed the form click the download icon in the toolbar to download a copy of the finished PDF. Or send it for signing.Open a free account on Fill here
-
How can I electronically fill out a PDF form?
You’ll need a PDF editor to fill out forms. I recommend you PDF Expert, it’s a great solution for Mac.What forms it supports:Acro forms created in signNow or similar programs.Static XFA forms created in signNow LiveCycle.PDF Expert supports checkboxes and text fields. Just click them and type what you need.If your form is non-interactive, you can type on it using the ‘Text’ tool (go to the ‘Annotate’ tab > ‘Text’).For a non-interactive checkbox, you can use the ‘Stamp’ tool or just type ‘x’ on it.For a more detailed tutorial, check the article “How to fill out a PDF form on Mac”. And here are the guides on how to fill out different tax forms.Hopefully, this helps!
-
How do you fill out a form scanned as a PDF?
If you have Acrobat Reader or Foxit Phantom, you can add form to the PDF file you want to fill in. Refer to the screenshot here (Phantom). First click on Form, then you can pick option you want for your form (Text Field, Check box…) and draw it where you want to input your data. You can also change font and size of it to fit the existing text. When you are done adding the fields, you can just click on the hand icon, and you can now fill in your form and then save it as.
-
What is the best way to fill out a PDF form?
If you are a user of Mac, iPhone or iPad, your tasks will be quickly and easily solved with the help of PDF Expert. Thanks to a simple and intuitive design, you don't have to dig into settings and endless options. PDF Expert also allows you to view, edit, reduce, merge, extract, annotate important parts of documents in a click. You have a special opportunity to try it on your Mac for free!
-
Is it possible to display a PDF form on mobile web to fill out and get e-signed?
Of course, you can try a web called eSign+. This site let you upload PDF documents and do some edition eg. drag signature fields, add date and some informations. Then you can send to those, from whom you wanna get signatures.
-
Is there a service that will allow me to create a fillable form on a webpage, and then email a PDF copy of each form filled out?
You can use Fill which is has a free forever plan.You can use Fill to turn your PDF document into an online document which can be completed, signed and saved as a PDF, online.You will end up with a online fillable PDF like this:w9 || FillWhich can be embedded in your website should you wish.InstructionsStep 1: Open an account at Fill and clickStep 2: Check that all the form fields are mapped correctly, if not drag on the text fields.Step 3: Save it as a templateStep 4: Goto your templates and find the correct form. Then click on the embed settings to grab your form URL.
-
Is there a software or online service to fill out immigration PDF forms automatically from a web form?
If you are looking to fill out form without downloading the form and without any apps installed, then please try PDF.co ! It is capable of filling out any web form using just a link to a source fillable form:
Create this form in 5 minutes!
How to create an eSignature for the sieve analysis graph pdf form
How to generate an electronic signature for the Sieve Analysis Graph Pdf Form in the online mode
How to create an eSignature for your Sieve Analysis Graph Pdf Form in Chrome
How to create an electronic signature for signing the Sieve Analysis Graph Pdf Form in Gmail
How to make an eSignature for the Sieve Analysis Graph Pdf Form straight from your smartphone
How to generate an eSignature for the Sieve Analysis Graph Pdf Form on iOS devices
How to generate an eSignature for the Sieve Analysis Graph Pdf Form on Android devices
People also ask
-
What is the Sieve Analysis Graph Excel Download feature in airSlate SignNow?
The Sieve Analysis Graph Excel Download feature in airSlate SignNow allows users to easily create and download detailed graphs based on their sieve analysis data. This feature streamlines the process of visualizing particle size distributions, making it efficient for engineers and scientists alike. By utilizing this feature, users can ensure accuracy and clarity in their reporting.
-
How can I access the Sieve Analysis Graph Excel Download feature?
To access the Sieve Analysis Graph Excel Download feature, simply sign up for an account on airSlate SignNow. Once you have an account, you can easily navigate to the tools section where this feature is located. It’s designed to be user-friendly, ensuring that you can generate and download your graphs with just a few clicks.
-
Is the Sieve Analysis Graph Excel Download included in all pricing plans?
Yes, the Sieve Analysis Graph Excel Download feature is included in all pricing plans offered by airSlate SignNow. Whether you choose a basic, professional, or enterprise plan, you will have access to this feature at no additional cost. This ensures that all users can benefit from advanced graphing capabilities.
-
What are the benefits of using the Sieve Analysis Graph Excel Download?
The Sieve Analysis Graph Excel Download offers several benefits, including time savings and enhanced data visualization. By downloading your sieve analysis data in Excel format, you can easily manipulate and analyze the information further. This feature helps improve accuracy in reporting and decision-making processes for your projects.
-
Can I integrate the Sieve Analysis Graph Excel Download with other software?
Yes, airSlate SignNow allows integration with various third-party applications and software, enhancing the utility of the Sieve Analysis Graph Excel Download. By connecting with tools like Google Sheets or project management software, you can streamline your workflow and improve data sharing. This integration capability ensures seamless collaboration across teams.
-
Is there a tutorial available for using the Sieve Analysis Graph Excel Download feature?
Absolutely! airSlate SignNow provides comprehensive tutorials and resources to help users understand how to utilize the Sieve Analysis Graph Excel Download feature effectively. These resources include step-by-step guides, video tutorials, and FAQs that cover common questions. You’ll find everything you need to become proficient in using this feature.
-
What types of sieve analysis data can I visualize with the Sieve Analysis Graph Excel Download?
With the Sieve Analysis Graph Excel Download, you can visualize various types of sieve analysis data, including particle size distribution and percentage passing. This versatility allows users from different industries, such as construction and pharmaceuticals, to apply the feature effectively. You can customize your graphs to suit your specific data needs.
Get more for Sieve Analysis Graph Excel Download
Find out other Sieve Analysis Graph Excel Download
- Sign West Virginia Real Estate Living Will Online
- How Can I Sign West Virginia Real Estate Confidentiality Agreement
- Sign West Virginia Real Estate Quitclaim Deed Computer
- Can I Sign West Virginia Real Estate Affidavit Of Heirship
- Sign West Virginia Real Estate Lease Agreement Template Online
- How To Sign Louisiana Police Lease Agreement
- Sign West Virginia Orthodontists Business Associate Agreement Simple
- How To Sign Wyoming Real Estate Operating Agreement
- Sign Massachusetts Police Quitclaim Deed Online
- Sign Police Word Missouri Computer
- Sign Missouri Police Resignation Letter Fast
- Sign Ohio Police Promissory Note Template Easy
- Sign Alabama Courts Affidavit Of Heirship Simple
- How To Sign Arizona Courts Residential Lease Agreement
- How Do I Sign Arizona Courts Residential Lease Agreement
- Help Me With Sign Arizona Courts Residential Lease Agreement
- How Can I Sign Arizona Courts Residential Lease Agreement
- Sign Colorado Courts LLC Operating Agreement Mobile
- Sign Connecticut Courts Living Will Computer
- How Do I Sign Connecticut Courts Quitclaim Deed