Lab Graphing and Interpreting a Survivorship Curve Form


What is the lab graphing and interpreting a survivorship curve?
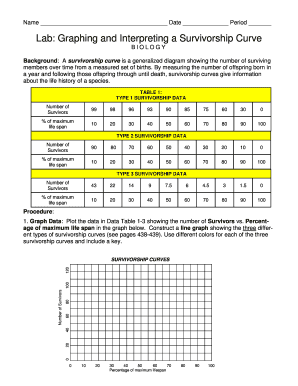
The lab graphing and interpreting a survivorship curve is a scientific exercise that illustrates the mortality rates of a population over time. This graphical representation is essential for understanding how different species survive through various life stages. Survivorship curves are categorized into three types: Type I, Type II, and Type III, each reflecting different survival strategies and life expectancies. For example, Type I curves represent species that have high survival rates in early and middle life but experience increased mortality in older age. Understanding these curves aids in ecological studies and population management.
How to use the lab graphing and interpreting a survivorship curve
Using the lab graphing and interpreting a survivorship curve involves several key steps. First, gather data on the age-specific survival rates of the population being studied. This data can be collected through field studies or existing research. Next, plot the data on a graph, with age on the x-axis and the number of survivors on the y-axis. The resulting curve will visually represent the survival pattern of the population. Analyze the shape of the curve to determine the type of survivorship and draw conclusions about the population's ecological dynamics.
Steps to complete the lab graphing and interpreting a survivorship curve
Completing the lab graphing and interpreting a survivorship curve involves a systematic approach:
- Collect data on the population's age and survival rates.
- Organize the data into a table for clarity.
- Choose the appropriate graphing software or tools for plotting.
- Plot the data points on the graph accurately.
- Connect the points to form the survivorship curve.
- Label the axes and provide a legend if necessary.
- Interpret the curve, identifying the type of survivorship and any ecological implications.
Key elements of the lab graphing and interpreting a survivorship curve
Several key elements are crucial for accurately graphing and interpreting a survivorship curve:
- Data Accuracy: Ensure that the data collected is reliable and representative of the population.
- Graphing Technique: Use appropriate scales and graphing methods to accurately reflect the data.
- Curve Interpretation: Understand the implications of the curve shape, which can indicate survival strategies.
- Contextual Analysis: Consider environmental factors and biological characteristics that may influence the survivorship curve.
Legal use of the lab graphing and interpreting a survivorship curve
The legal use of the lab graphing and interpreting a survivorship curve primarily pertains to research and educational contexts. It is essential to adhere to ethical guidelines when collecting data, especially if it involves endangered species or sensitive ecosystems. Proper citation of sources and transparency in methodology are crucial to maintain scientific integrity. Additionally, when publishing findings, ensure compliance with relevant regulations regarding data sharing and intellectual property.
Examples of using the lab graphing and interpreting a survivorship curve
Examples of using the lab graphing and interpreting a survivorship curve include:
- Studying the survival rates of sea turtles to inform conservation efforts.
- Analyzing the population dynamics of trees in a forest ecosystem.
- Investigating the life expectancy of various fish species in different aquatic environments.
- Assessing the impact of environmental changes on the survival of amphibians.
Quick guide on how to complete lab graphing and interpreting a survivorship curve
Complete Lab Graphing And Interpreting A Survivorship Curve effortlessly on any device
Web-based document management has become increasingly favored by businesses and individuals. It offers a flawless eco-friendly substitute to conventional printed and signed documents, allowing you to access the necessary form and securely store it online. airSlate SignNow equips you with all the tools required to create, modify, and electronically sign your documents promptly without delays. Manage Lab Graphing And Interpreting A Survivorship Curve on any device using airSlate SignNow's Android or iOS applications and simplify any document-related task today.
How to edit and electronically sign Lab Graphing And Interpreting A Survivorship Curve without any hassle
- Obtain Lab Graphing And Interpreting A Survivorship Curve and click Get Form to begin.
- Use the tools we provide to fill out your form.
- Emphasize pertinent sections of your documents or redact sensitive information with tools specifically designed for that purpose by airSlate SignNow.
- Generate your signature using the Sign feature, which takes just seconds and holds the same legal validity as a traditional handwritten signature.
- Verify the details and click on the Done button to save your changes.
- Select how you wish to submit your form, via email, text message (SMS), invite link, or download it to your computer.
Forget about lost or misplaced documents, tedious form searches, or errors that necessitate creating new document copies. airSlate SignNow meets your document management needs in just a few clicks from any device you prefer. Edit and electronically sign Lab Graphing And Interpreting A Survivorship Curve while ensuring clear communication at every phase of your form preparation process with airSlate SignNow.
Create this form in 5 minutes or less
Create this form in 5 minutes!
How to create an eSignature for the lab graphing and interpreting a survivorship curve
How to create an electronic signature for a PDF online
How to create an electronic signature for a PDF in Google Chrome
How to create an e-signature for signing PDFs in Gmail
How to create an e-signature right from your smartphone
How to create an e-signature for a PDF on iOS
How to create an e-signature for a PDF on Android
People also ask
-
What is included in the lab graphing and interpreting a survivorship curve answer key?
The lab graphing and interpreting a survivorship curve answer key includes detailed explanations, illustrative graphs, and insights into different survivorship patterns. It serves as an essential resource for students and educators, helping to clarify complex concepts. This answer key enhances understanding and supports effective learning.
-
How can airSlate SignNow facilitate the signing of my lab graphing and interpreting a survivorship curve answer key?
airSlate SignNow allows you to easily send your lab graphing and interpreting a survivorship curve answer key for signature through a user-friendly interface. You can upload documents, add signers, and track the signing process, all within a few clicks. This ensures a seamless workflow for you and your collaborators.
-
Is there a subscription fee for using airSlate SignNow?
Yes, airSlate SignNow offers various subscription plans that cater to different business needs and budgets. Each plan provides features that can enhance your document management processes, including those for educational materials like the lab graphing and interpreting a survivorship curve answer key. Visit our pricing page for detailed information.
-
Can I integrate airSlate SignNow with other tools for educational purposes?
Absolutely! airSlate SignNow offers integrations with various educational tools and platforms, enabling you to streamline your document workflows. By integrating with applications such as Google Drive and Microsoft Office, you can efficiently manage documents like the lab graphing and interpreting a survivorship curve answer key.
-
How secure is my data when using airSlate SignNow?
We prioritize your data security at airSlate SignNow. Our platform employs advanced encryption and compliance measures to protect sensitive information, including your lab graphing and interpreting a survivorship curve answer key. You can confidently send and store documents, knowing they are secure.
-
What features does airSlate SignNow offer for document collaboration?
airSlate SignNow includes robust collaboration features such as in-document commenting, version control, and real-time updates. This allows multiple users to work together efficiently on documents like the lab graphing and interpreting a survivorship curve answer key. Collaboration becomes seamless and productive.
-
Can I track who has viewed or signed the lab graphing and interpreting a survivorship curve answer key?
Yes, airSlate SignNow provides tracking features that let you monitor who has viewed or signed your documents. This is particularly useful for important educational materials like the lab graphing and interpreting a survivorship curve answer key, ensuring accountability and transparency in your workflows.
Get more for Lab Graphing And Interpreting A Survivorship Curve
- Divorce decree with children hawaii form
- Notice to lessor exercising option to purchase hawaii form
- Assignment of lease and rent from borrower to lender hawaii form
- Assignment of lease from lessor with notice of assignment hawaii form
- Letter from landlord to tenant as notice of abandoned personal property hawaii form
- Guaranty or guarantee of payment of rent hawaii form
- Letter from landlord to tenant as notice of default on commercial lease hawaii form
- Residential or rental lease extension agreement hawaii form
Find out other Lab Graphing And Interpreting A Survivorship Curve
- How Can I eSign Maine Legal NDA
- eSign Maryland Legal LLC Operating Agreement Safe
- Can I eSign Virginia Life Sciences Job Description Template
- eSign Massachusetts Legal Promissory Note Template Safe
- eSign West Virginia Life Sciences Agreement Later
- How To eSign Michigan Legal Living Will
- eSign Alabama Non-Profit Business Plan Template Easy
- eSign Mississippi Legal Last Will And Testament Secure
- eSign California Non-Profit Month To Month Lease Myself
- eSign Colorado Non-Profit POA Mobile
- How Can I eSign Missouri Legal RFP
- eSign Missouri Legal Living Will Computer
- eSign Connecticut Non-Profit Job Description Template Now
- eSign Montana Legal Bill Of Lading Free
- How Can I eSign Hawaii Non-Profit Cease And Desist Letter
- Can I eSign Florida Non-Profit Residential Lease Agreement
- eSign Idaho Non-Profit Business Plan Template Free
- eSign Indiana Non-Profit Business Plan Template Fast
- How To eSign Kansas Non-Profit Business Plan Template
- eSign Indiana Non-Profit Cease And Desist Letter Free