R717 Refrigerant Chart Form


What is the R717 Refrigerant Chart
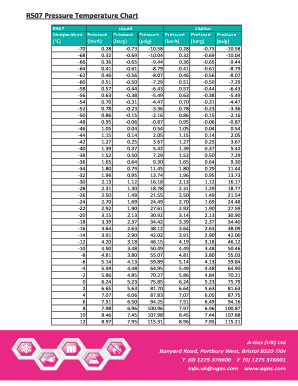
The R717 refrigerant chart, also known as the ammonia pressure temperature chart, provides essential data for understanding the properties of ammonia (NH3) as a refrigerant. This chart displays the relationship between pressure and temperature, allowing users to determine the appropriate operating conditions for ammonia-based refrigeration systems. It is particularly useful for HVAC professionals and engineers who work with industrial refrigeration systems. The chart typically includes saturation pressure and temperature values, enabling users to make informed decisions regarding system performance and efficiency.
How to use the R717 Refrigerant Chart
Using the R717 refrigerant chart involves several straightforward steps. First, identify the operating pressure of your ammonia system. Next, locate this pressure on the chart to find the corresponding saturation temperature. This information is crucial for ensuring that the system operates within safe and efficient parameters. Additionally, the chart can help diagnose issues by comparing actual system pressures and temperatures against the expected values. Regularly consulting the chart during maintenance can enhance system reliability and performance.
Key elements of the R717 Refrigerant Chart
The R717 refrigerant chart consists of several key elements that provide valuable information for users. These include:
- Saturation Pressure: The pressure at which ammonia changes from liquid to gas at a specific temperature.
- Saturation Temperature: The temperature at which ammonia changes from gas to liquid at a specific pressure.
- Critical Point: The temperature and pressure at which ammonia can no longer exist as a liquid and gas phase.
- Subcooling and Superheating Regions: Areas on the chart that indicate the conditions for subcooled liquid and superheated vapor.
Understanding these elements helps users effectively apply the chart in real-world scenarios, ensuring optimal system operation.
Steps to complete the R717 Refrigerant Chart
Completing the R717 refrigerant chart requires careful attention to detail. Follow these steps:
- Gather necessary data, including system pressure and temperature readings.
- Consult the chart to find the corresponding saturation temperature for the measured pressure.
- Record the data accurately, noting any discrepancies between actual and expected values.
- Use this information to assess system performance and identify any potential issues.
By following these steps, users can ensure their ammonia refrigeration systems operate efficiently and safely.
Legal use of the R717 Refrigerant Chart
The legal use of the R717 refrigerant chart is governed by regulations related to the handling and use of ammonia as a refrigerant. In the United States, compliance with the Environmental Protection Agency (EPA) guidelines is crucial. These regulations ensure that ammonia is used safely and responsibly, minimizing environmental impact. When using the chart, it is essential to adhere to these legal standards, particularly concerning safety protocols and reporting requirements for ammonia leaks or emissions. Understanding these legal implications helps users navigate the complexities of ammonia refrigeration systems.
Examples of using the R717 Refrigerant Chart
There are various practical applications for the R717 refrigerant chart in the field of refrigeration. Examples include:
- Determining the optimal pressure settings for a new ammonia refrigeration system during installation.
- Identifying potential issues in an existing system by comparing actual operating conditions against the chart.
- Assisting in troubleshooting by providing a reference for expected temperature and pressure relationships.
These examples illustrate how the chart can enhance the efficiency and reliability of ammonia refrigeration systems.
Quick guide on how to complete r717 refrigerant chart
Effortlessly Prepare R717 Refrigerant Chart on Any Device
Digital document management has become increasingly preferred by companies and individuals. It serves as a superb environmentally-friendly alternative to traditional printed and signed documents, as you can access the appropriate form and securely store it online. airSlate SignNow equips you with all the necessary tools to create, edit, and electronically sign your documents quickly and efficiently. Handle R717 Refrigerant Chart on any device with airSlate SignNow's Android or iOS applications and enhance any document-driven task today.
How to Edit and Electronically Sign R717 Refrigerant Chart with Ease
- Obtain R717 Refrigerant Chart and then click Get Form to begin.
- Utilize the tools available to complete your form.
- Emphasize signNow sections of your documents or obscure sensitive information using the tools that airSlate SignNow provides specifically for that purpose.
- Generate your signature with the Sign tool, which takes mere seconds and carries the same legal validity as a conventional handwritten signature.
- Review all the details and then click the Done button to save your changes.
- Choose how you would like to submit your form, via email, text (SMS), invitation link, or download it to your computer.
Eliminate the worries of lost or misfiled documents, tedious form searches, or errors that require new printed document copies. airSlate SignNow meets your document management needs with just a few clicks from your preferred device. Edit and electronically sign R717 Refrigerant Chart and ensure outstanding communication throughout the document preparation process with airSlate SignNow.
Create this form in 5 minutes or less
Create this form in 5 minutes!
How to create an eSignature for the r717 refrigerant chart
How to create an electronic signature for a PDF online
How to create an electronic signature for a PDF in Google Chrome
How to create an e-signature for signing PDFs in Gmail
How to create an e-signature right from your smartphone
How to create an e-signature for a PDF on iOS
How to create an e-signature for a PDF on Android
People also ask
-
What is an ammonia pt chart and how is it used?
An ammonia pt chart is a graphical representation that shows the relationship between pressure and temperature for ammonia. It is essential for understanding the thermodynamic properties of ammonia, particularly in industrial applications. This chart helps engineers and technicians make informed decisions regarding the handling and processing of ammonia.
-
How can the ammonia pt chart benefit my business?
Utilizing an ammonia pt chart can enhance efficiency in operations that involve ammonia, allowing your team to optimize processes and ensure safe handling. By understanding the critical points of ammonia, your business can improve safety protocols and reduce the risk of accidents. This knowledge is crucial for maintaining compliance and enhancing productivity.
-
Is the ammonia pt chart available in airSlate SignNow's functionalities?
While airSlate SignNow primarily focuses on document management and eSignatures, it allows integration with tools where an ammonia pt chart can be stored and shared. This means you can seamlessly incorporate your ammonia pt chart into your documentation processes, ensuring easy access for all team members. Thus, you can streamline your workflows while managing important data.
-
What features of airSlate SignNow support incorporating the ammonia pt chart?
AirSlate SignNow supports features such as document upload, sharing, and electronic signatures, which can enhance how you utilize an ammonia pt chart. You can upload the chart as a PDF or image, ensure it’s easily accessible, and have team members endorse it electronically. This brings convenience in managing and validating essential documents.
-
How does airSlate SignNow ensure the security of the ammonia pt chart?
Security is a top priority for airSlate SignNow, as it ensures that all documents, including your ammonia pt chart, are protected through encryption and secured data storage. This means that unauthorized access is minimized, safeguarding sensitive information related to ammonia handling and processing. You can confidently share your ammonia pt chart knowing that it’s secure.
-
What are the pricing options for airSlate SignNow?
AirSlate SignNow offers various pricing plans catering to different business needs, starting from affordable rates for small teams to premium options for larger enterprises. Each plan includes essential features such as document signing, templates, and cloud storage, which can seamlessly work with your ammonia pt chart. This flexibility ensures that businesses of all sizes can benefit from effective document management.
-
Can I integrate airSlate SignNow with other software for handling the ammonia pt chart?
Yes, airSlate SignNow supports a wide range of integrations with popular software tools, enhancing how you manage documents like the ammonia pt chart. This means you can connect with project management and data analysis tools to streamline workflows and improve collaboration. Effortlessly sync your ammonia pt chart with other applications for better efficiency.
Get more for R717 Refrigerant Chart
- Kentucky will form
- Kentucky legal last will and testament form for married person with adult and minor children
- Prenuptial premarital statements agreement form
- Massachusetts massachusetts prenuptial premarital agreement without financial statements form
- Massachusetts marital domestic separation and property settlement agreement for persons with no children no joint property or form
- Maryland prenuptial agreement form
- Maryland legal last will and testament form for a single person with minor children
- Maryland legal last will and testament form for divorced person not remarried with adult children 481376521
Find out other R717 Refrigerant Chart
- eSignature Georgia Business Operations Limited Power Of Attorney Online
- Help Me With eSignature South Carolina Banking Job Offer
- eSignature Tennessee Banking Affidavit Of Heirship Online
- eSignature Florida Car Dealer Business Plan Template Myself
- Can I eSignature Vermont Banking Rental Application
- eSignature West Virginia Banking Limited Power Of Attorney Fast
- eSignature West Virginia Banking Limited Power Of Attorney Easy
- Can I eSignature Wisconsin Banking Limited Power Of Attorney
- eSignature Kansas Business Operations Promissory Note Template Now
- eSignature Kansas Car Dealer Contract Now
- eSignature Iowa Car Dealer Limited Power Of Attorney Easy
- How Do I eSignature Iowa Car Dealer Limited Power Of Attorney
- eSignature Maine Business Operations Living Will Online
- eSignature Louisiana Car Dealer Profit And Loss Statement Easy
- How To eSignature Maryland Business Operations Business Letter Template
- How Do I eSignature Arizona Charity Rental Application
- How To eSignature Minnesota Car Dealer Bill Of Lading
- eSignature Delaware Charity Quitclaim Deed Computer
- eSignature Colorado Charity LLC Operating Agreement Now
- eSignature Missouri Car Dealer Purchase Order Template Easy