Graphing Linear Equations with Microsoft Excel Form


Understanding Graphing Linear Equations With Microsoft Excel
Graphing linear equations in Microsoft Excel is a powerful way to visualize relationships between variables. Excel allows users to create scatter plots and line graphs, which can effectively represent linear equations. A linear equation typically takes the form of y = mx + b, where m is the slope and b is the y-intercept. By inputting data points into Excel, users can generate a graph that illustrates how changes in one variable affect another.
Steps to Create a Graph of Linear Equations in Excel
To graph linear equations using Microsoft Excel, follow these steps:
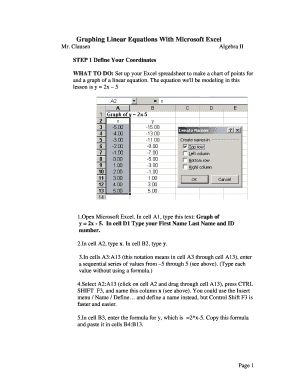
- Open Microsoft Excel and create a new spreadsheet.
- Input your data points in two columns, with one column for the x-values and another for the corresponding y-values.
- Select the data range you want to graph.
- Navigate to the 'Insert' tab on the ribbon and choose 'Scatter' from the Charts group.
- Select the 'Scatter with Straight Lines' option to create a line graph.
- Format the graph as needed, adjusting titles, labels, and colors for clarity.
Examples of Using Graphing Linear Equations in Excel
Graphing linear equations can be beneficial in various scenarios. For instance, educators can use it to demonstrate mathematical concepts in classrooms. Business analysts can visualize sales trends over time, helping to identify patterns and make informed decisions. Additionally, researchers can illustrate the relationship between two variables in their studies, providing a clear visual representation of their findings.
Software Compatibility for Graphing Linear Equations
Microsoft Excel is compatible with various operating systems, including Windows and macOS. It integrates well with other Microsoft Office applications, allowing users to import data from Word or PowerPoint easily. Additionally, Excel supports various file formats, making it easy to share graphs and data with others, whether they use Excel or other spreadsheet software.
Legal Use of Graphing Linear Equations in Excel
Using Microsoft Excel for graphing linear equations is legal and widely accepted in educational, professional, and research settings. However, users should ensure that any data used complies with relevant privacy laws and regulations, especially when handling sensitive information. Proper attribution should be given when using external data sources to maintain transparency and credibility.
Quick guide on how to complete graphing linear equations with microsoft excel
Complete [SKS] effortlessly on any device
Online document management has become increasingly popular among companies and individuals. It offers an ideal eco-friendly alternative to traditional printed and signed papers, as you can easily locate the correct form and securely store it online. airSlate SignNow provides all the tools necessary to create, modify, and eSign your documents quickly and without delays. Manage [SKS] on any device using airSlate SignNow Android or iOS applications and streamline any document-related process today.
How to alter and eSign [SKS] with ease
- Locate [SKS] and then select Get Form to begin.
- Use the tools we offer to fill out your form.
- Highlight pertinent sections of the documents or obscure sensitive information with tools that airSlate SignNow specifically provides for this purpose.
- Create your eSignature using the Sign tool, which takes moments and carries the same legal validity as a traditional wet ink signature.
- Review the information and click on the Done button to save your changes.
- Select your preferred method to send your form, whether by email, text message (SMS), or an invitation link, or download it to your computer.
Eliminate concerns about lost or misplaced files, tedious form searching, or errors that require printing new document copies. airSlate SignNow meets all your document management needs in just a few clicks from any device of your choosing. Modify and eSign [SKS] while ensuring effective communication at every stage of your form preparation with airSlate SignNow.
Create this form in 5 minutes or less
Related searches to Graphing Linear Equations With Microsoft Excel
Create this form in 5 minutes!
How to create an eSignature for the graphing linear equations with microsoft excel
How to create an electronic signature for a PDF online
How to create an electronic signature for a PDF in Google Chrome
How to create an e-signature for signing PDFs in Gmail
How to create an e-signature right from your smartphone
How to create an e-signature for a PDF on iOS
How to create an e-signature for a PDF on Android
People also ask
-
What is the best way to start Graphing Linear Equations With Microsoft Excel?
To begin Graphing Linear Equations With Microsoft Excel, you should first input your data points into a spreadsheet. Use the built-in chart tools to create a scatter plot, and then add a trendline to represent the linear equation. This method allows for a clear visual representation of your data.
-
Can I customize the appearance of my graphs when Graphing Linear Equations With Microsoft Excel?
Yes, Microsoft Excel offers various customization options for your graphs. You can change colors, add labels, and modify the chart style to enhance the visual appeal of your Graphing Linear Equations With Microsoft Excel. This flexibility helps in making your data more understandable.
-
Is there a cost associated with using Microsoft Excel for Graphing Linear Equations?
Microsoft Excel is part of the Microsoft Office suite, which requires a purchase or subscription. However, the investment is worthwhile for those frequently involved in Graphing Linear Equations With Microsoft Excel, as it provides powerful tools for data analysis and visualization.
-
What features does Microsoft Excel offer for Graphing Linear Equations?
Microsoft Excel includes features such as scatter plots, trendlines, and data labels that are essential for Graphing Linear Equations With Microsoft Excel. Additionally, you can use formulas to calculate slope and intercept, making it easier to visualize linear relationships in your data.
-
How can I integrate other tools with Microsoft Excel for better graphing?
You can integrate various data analysis tools and add-ins with Microsoft Excel to enhance your graphing capabilities. For instance, using Power Query can help you prepare your data more efficiently before Graphing Linear Equations With Microsoft Excel, leading to more accurate results.
-
What are the benefits of Graphing Linear Equations With Microsoft Excel for businesses?
Graphing Linear Equations With Microsoft Excel allows businesses to visualize trends and make data-driven decisions. It simplifies complex data analysis, making it easier to communicate insights to stakeholders. This capability can lead to improved strategies and operational efficiency.
-
Can I share my graphs created in Excel with others?
Absolutely! You can easily share your graphs created in Excel by exporting them as images or PDFs. Additionally, you can share the Excel file directly, allowing others to view or edit your Graphing Linear Equations With Microsoft Excel.
Get more for Graphing Linear Equations With Microsoft Excel
Find out other Graphing Linear Equations With Microsoft Excel
- eSign Hawaii Courts Contract Mobile
- eSign Hawaii Courts RFP Online
- How To eSign Hawaii Courts RFP
- eSign Hawaii Courts Letter Of Intent Later
- eSign Hawaii Courts IOU Myself
- eSign Hawaii Courts IOU Safe
- Help Me With eSign Hawaii Courts Cease And Desist Letter
- How To eSign Massachusetts Police Letter Of Intent
- eSign Police Document Michigan Secure
- eSign Iowa Courts Emergency Contact Form Online
- eSign Kentucky Courts Quitclaim Deed Easy
- How To eSign Maryland Courts Medical History
- eSign Michigan Courts Lease Agreement Template Online
- eSign Minnesota Courts Cease And Desist Letter Free
- Can I eSign Montana Courts NDA
- eSign Montana Courts LLC Operating Agreement Mobile
- eSign Oklahoma Sports Rental Application Simple
- eSign Oklahoma Sports Rental Application Easy
- eSign Missouri Courts Lease Agreement Template Mobile
- Help Me With eSign Nevada Police Living Will