Assessment Scatterplot Form


What is the Assessment Scatterplot
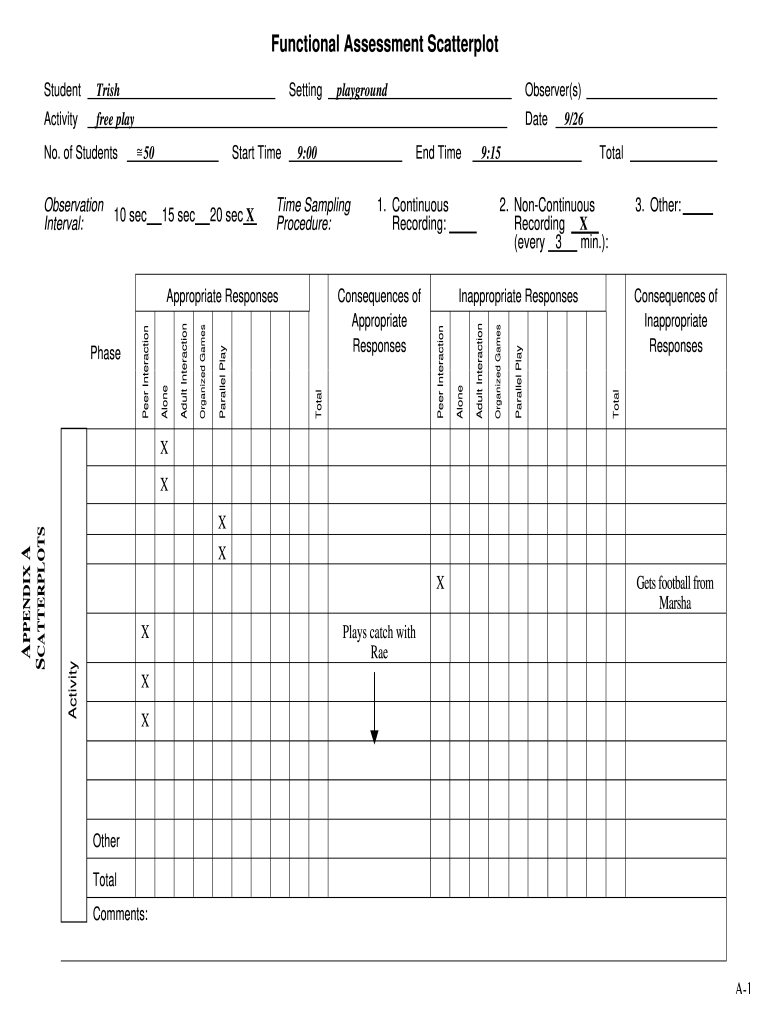
The assessment scatterplot is a visual tool used to analyze and represent data related to behavioral assessments. It typically displays individual data points that correspond to specific behaviors and their frequencies or intensities. This tool is particularly useful in fields such as education and psychology, where understanding behavior patterns is crucial. By plotting data points on a two-dimensional graph, practitioners can easily identify trends, patterns, and outliers in behavior, facilitating informed decision-making.
How to use the Assessment Scatterplot
Using the assessment scatterplot involves several key steps. First, gather the relevant data regarding the behaviors you wish to analyze. This data can include frequency counts, duration, or intensity of specific behaviors. Next, plot these data points on the scatterplot, with one axis representing the behavior's frequency and the other representing time or another relevant variable. Once the data is plotted, you can analyze the visual representation to identify patterns, such as increases or decreases in specific behaviors over time.
Steps to complete the Assessment Scatterplot
Completing the assessment scatterplot requires a systematic approach. Start by defining the behaviors to be assessed and collecting data over a specified period. Follow these steps:
- Identify the specific behaviors to analyze.
- Collect data on these behaviors consistently over time.
- Choose appropriate intervals for data collection (daily, weekly, etc.).
- Plot the collected data points on the scatterplot.
- Review the plotted data for trends and patterns.
This structured process ensures that the scatterplot accurately reflects the behaviors being assessed, allowing for effective analysis.
Key elements of the Assessment Scatterplot
Several key elements contribute to the effectiveness of the assessment scatterplot. These include:
- Axes: The horizontal and vertical axes should be clearly labeled to indicate the behaviors being measured and the time frame or intensity.
- Data Points: Each point on the scatterplot represents an observation of behavior, making it essential to plot accurately.
- Legends: If multiple behaviors are plotted, a legend can help distinguish between different data sets.
- Trends: Observing the overall direction of the data points can reveal important trends in behavior over time.
Incorporating these elements ensures that the scatterplot is both informative and easy to interpret.
Legal use of the Assessment Scatterplot
The legal use of the assessment scatterplot is essential, especially when the data is used for decision-making in educational or clinical settings. It is important to ensure that the data collection and analysis comply with relevant laws and regulations, such as the Family Educational Rights and Privacy Act (FERPA) and the Health Insurance Portability and Accountability Act (HIPAA). Proper consent must be obtained from individuals whose data is being collected, and the data should be stored securely to protect privacy. Adhering to these legal requirements helps maintain the integrity and validity of the assessment process.
Examples of using the Assessment Scatterplot
Assessment scatterplots can be applied in various scenarios. For instance, educators may use them to track a student's behavioral progress over time, allowing for timely interventions. Similarly, psychologists might employ scatterplots to analyze the frequency of specific behaviors in therapy sessions, aiding in treatment planning. These examples illustrate the versatility of the assessment scatterplot in different contexts, emphasizing its role in data-driven decision-making.
Quick guide on how to complete assessment scatterplot
Effortlessly Complete Assessment Scatterplot on Any Device
Digital document management has become increasingly favored by businesses and individuals. It offers an ideal environmentally friendly alternative to traditional printed and signed documents, as you can access the necessary form and securely keep it online. airSlate SignNow provides all the resources you need to produce, modify, and eSign your documents swiftly without delays. Manage Assessment Scatterplot on any device using the airSlate SignNow apps for Android or iOS, and simplify any document-focused task today.
The Easiest Way to Alter and eSign Assessment Scatterplot with Ease
- Find Assessment Scatterplot and click Get Form to initiate.
- Employ the tools we provide to complete your form.
- Mark important sections of the documents or redact sensitive information with tools specifically designed for that purpose by airSlate SignNow.
- Generate your signature using the Sign feature, which takes seconds and holds the same legal significance as a conventional handwritten signature.
- Review the details and then click the Done button to save your changes.
- Select your preferred method for sharing your form, whether by email, SMS, invitation link, or download it to your computer.
Eliminate concerns about missing or lost files, tedious form searches, or mistakes that necessitate printing new document copies. airSlate SignNow meets all your document management needs in just a few clicks from any device you prefer. Adjust and eSign Assessment Scatterplot to guarantee outstanding communication at every stage of the form preparation process with airSlate SignNow.
Create this form in 5 minutes or less
Create this form in 5 minutes!
How to create an eSignature for the assessment scatterplot
The way to make an eSignature for your PDF file in the online mode
The way to make an eSignature for your PDF file in Chrome
The way to make an eSignature for putting it on PDFs in Gmail
The best way to make an electronic signature straight from your smartphone
The way to make an electronic signature for a PDF file on iOS devices
The best way to make an electronic signature for a PDF document on Android
People also ask
-
What is an aba scatterplot data sheet?
An aba scatterplot data sheet is a structured document used for visualizing data points based on two variables, allowing for better analysis and decision-making. This tool is essential for organizations looking to interpret trends and relationships within their data effectively.
-
How can I integrate the aba scatterplot data sheet with airSlate SignNow?
You can easily integrate the aba scatterplot data sheet with airSlate SignNow through our API or by importing your data directly. This seamless integration ensures that you can utilize your scatterplot data efficiently within your document workflows.
-
Is there a cost associated with using the aba scatterplot data sheet feature?
The aba scatterplot data sheet feature is included in the pricing plans of airSlate SignNow, making it a cost-effective solution for your document management needs. You can explore our various pricing tiers to find the best fit for your business.
-
What are the benefits of using the aba scatterplot data sheet in my reports?
Using the aba scatterplot data sheet in your reports enhances data visualization, making it easier to identify patterns and correlations. This insight helps in making informed decisions and can signNowly improve your reporting efficiency.
-
Can I customize the aba scatterplot data sheet to suit my needs?
Yes, the aba scatterplot data sheet is fully customizable, allowing you to tailor it to your specific data visualization needs. This flexibility ensures that you can highlight the most relevant information for your audience.
-
What types of data can I include in the aba scatterplot data sheet?
You can include a wide range of data types in the aba scatterplot data sheet, including numerical, categorical, and time-series data. This versatility aids in conducting comprehensive analyses across various sectors and applications.
-
Does airSlate SignNow provide templates for the aba scatterplot data sheet?
Yes, airSlate SignNow offers several templates for the aba scatterplot data sheet that you can use as starting points. These templates are designed to help you set up your data visualization quickly and efficiently.
Get more for Assessment Scatterplot
- Uj o u u ti o w u u new jersey state library form
- For oil and gas facilities form
- Surface lease with subsurface agreement no state of form
- By lessor who owns surface prohibiting drilling form
- Waiver of lease provision form
- Watershed international development research centre form
- Legacy02 multi state lease forms oil ampampamp gas legal forms
- Texas oil and gas leasing a primer form
Find out other Assessment Scatterplot
- Can I eSign North Carolina Courts Limited Power Of Attorney
- eSign North Dakota Courts Quitclaim Deed Safe
- How To eSign Rhode Island Sports Quitclaim Deed
- Help Me With eSign Oregon Courts LLC Operating Agreement
- eSign North Dakota Police Rental Lease Agreement Now
- eSign Tennessee Courts Living Will Simple
- eSign Utah Courts Last Will And Testament Free
- eSign Ohio Police LLC Operating Agreement Mobile
- eSign Virginia Courts Business Plan Template Secure
- How To eSign West Virginia Courts Confidentiality Agreement
- eSign Wyoming Courts Quitclaim Deed Simple
- eSign Vermont Sports Stock Certificate Secure
- eSign Tennessee Police Cease And Desist Letter Now
- Help Me With eSign Texas Police Promissory Note Template
- eSign Utah Police LLC Operating Agreement Online
- eSign West Virginia Police Lease Agreement Online
- eSign Wyoming Sports Residential Lease Agreement Online
- How Do I eSign West Virginia Police Quitclaim Deed
- eSignature Arizona Banking Moving Checklist Secure
- eSignature California Banking Warranty Deed Later