DD Form 1207, Grain Size Distribution Graph Aggregate Gradation Chart, December


What is the DD Form 1207, Grain Size Distribution Graph Aggregate Gradation Chart, December
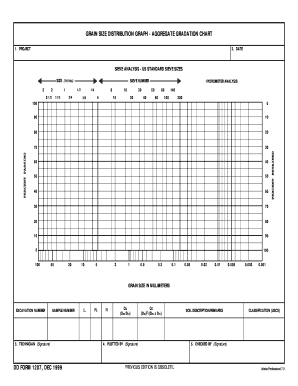
The DD Form 1207, also known as the Grain Size Distribution Graph Aggregate Gradation Chart, is a crucial document used primarily in construction and engineering projects. This form provides a standardized method for representing the particle size distribution of aggregate materials. It is essential for ensuring that the materials meet specific engineering standards and specifications. The form captures data that helps in evaluating the suitability of aggregates for various construction applications, ensuring compliance with industry regulations.
How to use the DD Form 1207, Grain Size Distribution Graph Aggregate Gradation Chart, December
Using the DD Form 1207 involves several steps that ensure accurate data representation. First, gather the necessary aggregate samples for testing. Next, perform a sieve analysis to determine the particle size distribution. Once the analysis is complete, fill out the form by plotting the results on the graph provided. This graph visually represents the distribution of different particle sizes, which is critical for assessing the quality and suitability of the aggregate for construction purposes. After completing the form, it should be reviewed for accuracy before submission.
Steps to complete the DD Form 1207, Grain Size Distribution Graph Aggregate Gradation Chart, December
Completing the DD Form 1207 requires a systematic approach to ensure all necessary information is accurately recorded. The following steps outline the process:
- Collect aggregate samples for testing.
- Conduct a sieve analysis to determine the size distribution of the particles.
- Record the results of the sieve analysis in the appropriate sections of the form.
- Plot the particle size distribution on the graph provided in the form.
- Review the completed form for any errors or omissions.
- Submit the form as required for your specific project or regulatory needs.
Key elements of the DD Form 1207, Grain Size Distribution Graph Aggregate Gradation Chart, December
The DD Form 1207 includes several key elements that are essential for its effective use. These elements consist of:
- Aggregate Sample Identification: Clearly label the sample being tested.
- Sieve Sizes: List the various sieve sizes used during the analysis.
- Weight Retained: Document the weight of aggregate retained on each sieve.
- Percent Passing: Calculate and record the percentage of material that passes through each sieve.
- Graph Representation: Provide a visual representation of the particle size distribution.
Legal use of the DD Form 1207, Grain Size Distribution Graph Aggregate Gradation Chart, December
The legal use of the DD Form 1207 is significant in the context of construction and engineering projects. This form must be completed accurately and submitted in compliance with local, state, and federal regulations. Proper documentation ensures that the aggregates used in construction meet safety and quality standards, which can be crucial in legal contexts, such as disputes over construction quality or compliance with building codes. Maintaining accurate records of the DD Form 1207 can also support liability claims and regulatory inspections.
Examples of using the DD Form 1207, Grain Size Distribution Graph Aggregate Gradation Chart, December
The DD Form 1207 is utilized in various scenarios within the construction industry. For instance:
- In highway construction, it helps determine the suitability of aggregate for asphalt mixtures.
- In concrete production, it ensures that the aggregate meets the required specifications for strength and durability.
- In environmental assessments, it assists in evaluating the impact of aggregate materials on soil and water quality.
Quick guide on how to complete dd form 1207 grain size distribution graph aggregate gradation chart december
Effortlessly Prepare DD Form 1207, Grain Size Distribution Graph Aggregate Gradation Chart, December on Any Device
Managing documents online has become increasingly popular among businesses and individuals. It serves as an ideal environmentally friendly substitute for conventional printed and signed paperwork, allowing you to access the right template and securely store it on the web. airSlate SignNow equips you with all the tools necessary to create, modify, and electronically sign your documents quickly and without delays. Administer DD Form 1207, Grain Size Distribution Graph Aggregate Gradation Chart, December on any device using airSlate SignNow's Android or iOS applications and streamline any document-related workflow today.
How to Edit and Electronically Sign DD Form 1207, Grain Size Distribution Graph Aggregate Gradation Chart, December with Ease
- Find DD Form 1207, Grain Size Distribution Graph Aggregate Gradation Chart, December and click Get Form to begin.
- Utilize the tools provided to complete your form.
- Highlight important sections of the documents or obscure sensitive data using tools specifically designed for that purpose by airSlate SignNow.
- Create your electronic signature using the Sign tool, which takes just seconds and carries the same legal validity as a conventional ink signature.
- Review all details and click the Done button to save your modifications.
- Select your preferred method for sending your form, whether by email, SMS, invitation link, or downloading it to your computer.
Eliminate the stress of lost or misplaced files, tedious form searches, or mistakes that necessitate reprinting document copies. airSlate SignNow fulfills all your documentation management requirements in just a few clicks from any device you choose. Modify and electronically sign DD Form 1207, Grain Size Distribution Graph Aggregate Gradation Chart, December and guarantee excellent communication at every stage of the form preparation process with airSlate SignNow.
Create this form in 5 minutes or less
Create this form in 5 minutes!
How to create an eSignature for the dd form 1207 grain size distribution graph aggregate gradation chart december
How to create an electronic signature for a PDF online
How to create an electronic signature for a PDF in Google Chrome
How to create an e-signature for signing PDFs in Gmail
How to create an e-signature right from your smartphone
How to create an e-signature for a PDF on iOS
How to create an e-signature for a PDF on Android
People also ask
-
What is a grain size distribution graph blank?
A grain size distribution graph blank is a template used to visually represent the distribution of grain sizes within a sample. It helps in analyzing the granular material's characteristics, which is crucial for various industries like construction and materials science.
-
How can I use a grain size distribution graph blank for my business?
You can use a grain size distribution graph blank to efficiently document and analyze the grain sizes of materials in your projects. This tool simplifies data visualization, allowing stakeholders to quickly interpret results and make informed decisions.
-
What features should I look for in a grain size distribution graph blank tool?
When selecting a grain size distribution graph blank tool, look for features like customizable templates, easy data input, and clear visualization options. Integration with other software and the ability to export results are also important for seamless workflow.
-
Is there a cost associated with using a grain size distribution graph blank in airSlate SignNow?
Using a grain size distribution graph blank in airSlate SignNow is part of the broader document management offerings, which are cost-effective. Pricing may vary based on the features you need, but the platform ensures value for businesses looking to streamline their document workflows.
-
Can the grain size distribution graph blank be customized?
Yes, our grain size distribution graph blank can be fully customized to meet your specific needs. You can adjust parameters such as axis labels, data input sections, and overall layout to fit your project requirements.
-
What are the benefits of using airSlate SignNow for grain size distribution graphs?
Using airSlate SignNow for grain size distribution graphs provides an efficient way to manage and eSign related documents. The platform’s user-friendly interface and robust features enhance productivity, making it easier to collaborate on important data.
-
Are there integrations available for the grain size distribution graph blank?
Yes, airSlate SignNow offers various integrations that allow you to connect with other tools and platforms. This includes software that assists in data collection and analysis, enhancing your ability to generate accurate grain size distribution graphs.
Get more for DD Form 1207, Grain Size Distribution Graph Aggregate Gradation Chart, December
Find out other DD Form 1207, Grain Size Distribution Graph Aggregate Gradation Chart, December
- How To Integrate Sign in Banking
- How To Use Sign in Banking
- Help Me With Use Sign in Banking
- Can I Use Sign in Banking
- How Do I Install Sign in Banking
- How To Add Sign in Banking
- How Do I Add Sign in Banking
- How Can I Add Sign in Banking
- Can I Add Sign in Banking
- Help Me With Set Up Sign in Government
- How To Integrate eSign in Banking
- How To Use eSign in Banking
- How To Install eSign in Banking
- How To Add eSign in Banking
- How To Set Up eSign in Banking
- How To Save eSign in Banking
- How To Implement eSign in Banking
- How To Set Up eSign in Construction
- How To Integrate eSign in Doctors
- How To Use eSign in Doctors