Graphing Points from a Ratio Table Form


What is the graphing points from a ratio table
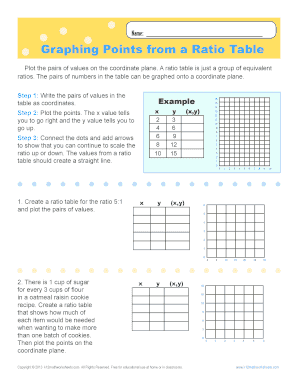
A ratio table is a structured way to display equivalent ratios, allowing for easy comparison and analysis. When graphing points from a ratio table, each pair of values in the table corresponds to a point on a coordinate plane. The first value typically represents the x-coordinate, while the second value represents the y-coordinate. This visual representation helps in understanding relationships between quantities and can be particularly useful in various mathematical applications.
How to use the graphing points from a ratio table
To effectively use the graphing points from a ratio table, start by identifying the pairs of numbers within the table. Each pair will be plotted as a point on the graph. For example, if a ratio table lists the pairs (1, 2), (2, 4), and (3, 6), you would plot these points on a coordinate plane. The x-coordinate is taken from the first number, and the y-coordinate is taken from the second. Once plotted, these points can be connected to form a line, illustrating the relationship between the two quantities.
Steps to complete the graphing points from a ratio table
Completing the graphing of points from a ratio table involves several steps:
- Identify the ratio pairs from the table.
- Set up a coordinate plane with appropriate scales on both axes.
- Plot each pair of values as a point on the graph.
- Label the axes to indicate what each represents.
- Connect the points if they form a linear relationship.
Following these steps will help ensure an accurate representation of the data from the ratio table.
Examples of using the graphing points from a ratio table
Consider a simple ratio table that lists the following pairs: (1, 3), (2, 6), (3, 9). When graphing these points:
- Plot (1, 3) on the graph.
- Plot (2, 6) on the graph.
- Plot (3, 9) on the graph.
These points can be connected to illustrate a linear relationship, indicating that as the x-value increases, the y-value increases proportionally. This example highlights how ratio tables can be visually represented and analyzed through graphing.
Key elements of the graphing points from a ratio table
When graphing points from a ratio table, several key elements should be considered:
- The accuracy of the ratio pairs listed in the table.
- The scale of the axes on the graph to ensure proper representation.
- Clear labeling of the axes to indicate what the x and y values represent.
- The method of connecting points, if applicable, to show relationships.
Understanding these elements will enhance the clarity and effectiveness of the graph created from the ratio table.
Quick guide on how to complete graphing points from a ratio table
Effortlessly Prepare Graphing Points From A Ratio Table on Any Device
Digital document management has gained traction among businesses and individuals alike. It serves as an ideal environmentally-friendly alternative to traditional printed and signed documentation, allowing you to access the necessary form and securely save it online. airSlate SignNow provides all the tools you need to create, modify, and electronically sign your documents promptly without any delays. Manage Graphing Points From A Ratio Table on any device using the airSlate SignNow apps for Android or iOS and enhance any document-driven process today.
How to Edit and eSign Graphing Points From A Ratio Table with Ease
- Locate Graphing Points From A Ratio Table and then click Get Form to begin.
- Utilize the tools we offer to fill out your document.
- Highlight important sections of the documents or obscure sensitive information with tools that airSlate SignNow specifically offers for this purpose.
- Create your signature using the Sign tool, which only takes seconds and carries the same legal validity as a conventional wet ink signature.
- Review all the details and then click on the Done button to preserve your changes.
- Choose your preferred method to send your form, whether by email, SMS, or invite link, or download it to your computer.
Eliminate the worry of lost or misplaced files, tedious document searches, or mistakes that necessitate printing new copies. airSlate SignNow meets all your document management needs in just a few clicks from any device you prefer. Edit and eSign Graphing Points From A Ratio Table and ensure effective communication at every stage of your form preparation process with airSlate SignNow.
Create this form in 5 minutes or less
Create this form in 5 minutes!
How to create an eSignature for the graphing points from a ratio table
How to create an electronic signature for a PDF online
How to create an electronic signature for a PDF in Google Chrome
How to create an e-signature for signing PDFs in Gmail
How to create an e-signature right from your smartphone
How to create an e-signature for a PDF on iOS
How to create an e-signature for a PDF on Android
People also ask
-
What is a ratio table and how can it help my business?
A ratio table is a tool that displays the relationship between two quantities, making it easier for businesses to analyze and interpret data. By utilizing a ratio table, you can effectively manage resources, forecast performance, and make informed decisions based on numerical relationships.
-
How does airSlate SignNow support the creation of ratio tables?
With airSlate SignNow, you can easily create and manage ratio tables in your documents for better data visualization. Our platform allows you to integrate these tables into your e-signature workflows, ensuring that all team members can access important ratios and data points seamlessly.
-
Is there a cost associated with using ratio tables in airSlate SignNow?
Using ratio tables within airSlate SignNow comes at no additional cost beyond your regular subscription. We offer various pricing plans that provide access to features like document signing and data organization tools, including ratio tables, which enhance your overall user experience.
-
Can I integrate ratio tables with other software tools using airSlate SignNow?
Yes, airSlate SignNow allows easy integrations with various software tools, enabling you to import and export ratio tables effortlessly. This functionality ensures that you can consolidate your data and maintain consistency across different platforms, enhancing workflow efficiency in your business.
-
What are the benefits of using ratio tables in my documents?
Integrating ratio tables in your documents allows for clear data presentation, better comparison of values, and enhanced decision-making capabilities. AirSlate SignNow's ratio table feature helps you illustrate important information in a structured format, making communication clearer amongst stakeholders.
-
Are there any templates available for ratio tables in airSlate SignNow?
Absolutely! AirSlate SignNow offers customizable templates that include ratio tables to streamline your document creation process. These templates help you get started quickly while ensuring that all necessary ratios are represented accurately, saving you time and effort.
-
How does using a ratio table improve my document workflows?
Incorporating a ratio table into your document workflows allows for efficient organization of numerical data, fostering quicker insights and decisions. AirSlate SignNow enhances this process by enabling easy editing and sharing of documents, ensuring that your team has the most up-to-date information at their fingertips.
Get more for Graphing Points From A Ratio Table
- Letter from tenant to landlord about sexual harassment new york form
- Letter from tenant to landlord about fair housing reduction or denial of services to family with children new york form
- Tenant landlord form template
- Letter from tenant to landlord responding to notice to terminate for noncompliance noncompliant condition caused by landlords 497321299 form
- Landlord failure form
- Ny codes form
- Letter from landlord to tenant where tenant complaint was caused by the deliberate or negligent act of tenant or tenants guest 497321302 form
- Letter from landlord to tenant for failure to keep premises as clean and safe as condition of premises permits remedy or lease 497321303 form
Find out other Graphing Points From A Ratio Table
- eSign North Dakota Real Estate Business Letter Template Computer
- eSign North Dakota Real Estate Quitclaim Deed Myself
- eSign Maine Sports Quitclaim Deed Easy
- eSign Ohio Real Estate LLC Operating Agreement Now
- eSign Ohio Real Estate Promissory Note Template Online
- How To eSign Ohio Real Estate Residential Lease Agreement
- Help Me With eSign Arkansas Police Cease And Desist Letter
- How Can I eSign Rhode Island Real Estate Rental Lease Agreement
- How Do I eSign California Police Living Will
- Can I eSign South Dakota Real Estate Quitclaim Deed
- How To eSign Tennessee Real Estate Business Associate Agreement
- eSign Michigan Sports Cease And Desist Letter Free
- How To eSign Wisconsin Real Estate Contract
- How To eSign West Virginia Real Estate Quitclaim Deed
- eSign Hawaii Police Permission Slip Online
- eSign New Hampshire Sports IOU Safe
- eSign Delaware Courts Operating Agreement Easy
- eSign Georgia Courts Bill Of Lading Online
- eSign Hawaii Courts Contract Mobile
- eSign Hawaii Courts RFP Online