Blank Frequency Table Form


What is the Blank Frequency Table
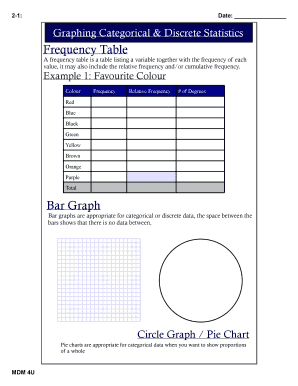
The blank frequency table is a structured format used in statistics to organize and display data points in categories. It allows users to record the frequency of occurrences for each category, making it easier to analyze and interpret data. This table is particularly useful for visualizing categorical data, where the values are distinct and non-numeric, such as survey responses or demographic information. By filling out a blank frequency table, users can gain insights into patterns and trends within their data set.
How to use the Blank Frequency Table
Using a blank frequency table involves several straightforward steps. First, identify the categories relevant to your data. Next, create a column for each category in the table. As you collect data, tally the occurrences for each category in the corresponding column. This process helps in summarizing the data effectively. Once all data points are recorded, the table can be analyzed to determine which categories have the highest or lowest frequencies, providing valuable insights into the dataset.
Steps to complete the Blank Frequency Table
Completing a blank frequency table requires a systematic approach. Follow these steps:
- Define the categories based on the data you are analyzing.
- Create a table with columns for each category and a column for frequency counts.
- As you gather data, record each occurrence in the appropriate category column.
- Once all data is collected, count the tallies for each category and write the totals in the frequency column.
- Review the completed table for accuracy and completeness.
Key elements of the Blank Frequency Table
A blank frequency table consists of several key elements that enhance its functionality. These include:
- Categories: The distinct groups or classifications that data points belong to.
- Frequency Count: The number of occurrences for each category, typically recorded as tallies.
- Total Row: A row that summarizes the total frequency count for all categories.
- Labels: Clear headings for each column to ensure the table is easy to understand.
Examples of using the Blank Frequency Table
Examples of using a blank frequency table can be found in various fields. In education, teachers may use it to track student responses to a survey about learning preferences. In marketing, businesses might utilize it to analyze customer feedback on product features. Each example illustrates how the blank frequency table can effectively summarize categorical data, allowing for easier analysis and decision-making.
Digital vs. Paper Version
The blank frequency table can be utilized in both digital and paper formats. The digital version allows for easy editing and data manipulation, making it suitable for statistical software or spreadsheets. Conversely, the paper version is beneficial for quick notes or classroom settings where technology may not be available. Each format has its advantages, and the choice depends on the user's needs and the context in which the table is being used.
Quick guide on how to complete blank frequency table
Get Blank Frequency Table ready effortlessly on any device
Digital document management has gained traction among companies and individuals alike. It offers an ideal eco-friendly solution to conventional printed and signed paperwork, as you can easily find the necessary template and securely keep it online. airSlate SignNow equips you with all the tools needed to create, modify, and electronically sign your documents promptly without any hold-ups. Manage Blank Frequency Table on any device using the airSlate SignNow Android or iOS applications and enhance any document-related task today.
How to modify and eSign Blank Frequency Table without hassle
- Find Blank Frequency Table and click Get Form to commence.
- Utilize the tools we provide to fill out your form.
- Emphasize important sections of the documents or redact sensitive details with tools offered by airSlate SignNow specifically for that purpose.
- Generate your eSignature using the Sign tool, which takes just seconds and carries the same legal validity as a traditional handwritten signature.
- Review the information and click the Done button to save your modifications.
- Choose how you want to send your form, via email, text message (SMS), or invitation link, or download it to your computer.
Say goodbye to lost or misplaced documents, tedious form searches, or errors that necessitate printing new document copies. airSlate SignNow addresses your document management needs in just a few clicks from any device you prefer. Modify and eSign Blank Frequency Table to ensure effective communication at every stage of the form preparation journey with airSlate SignNow.
Create this form in 5 minutes or less
Create this form in 5 minutes!
How to create an eSignature for the blank frequency table
How to create an electronic signature for a PDF online
How to create an electronic signature for a PDF in Google Chrome
How to create an e-signature for signing PDFs in Gmail
How to create an e-signature right from your smartphone
How to create an e-signature for a PDF on iOS
How to create an e-signature for a PDF on Android
People also ask
-
What is the 2012 graphing categorical frequency discrete statistics table add?
The 2012 graphing categorical frequency discrete statistics table add is a feature that allows users to visualize and analyze categorical data effectively. It helps in creating detailed graphs and tables that represent frequency distributions, making it easier to interpret statistical information.
-
How can I use the 2012 graphing categorical frequency discrete statistics table add in my business?
You can use the 2012 graphing categorical frequency discrete statistics table add to enhance your data analysis capabilities. By integrating this feature, you can create comprehensive reports that help in decision-making and presenting data insights to stakeholders.
-
Is the 2012 graphing categorical frequency discrete statistics table add included in the pricing plans?
Yes, the 2012 graphing categorical frequency discrete statistics table add is included in our pricing plans. We offer various subscription options that provide access to this feature, ensuring you get the best value for your investment.
-
What are the benefits of using the 2012 graphing categorical frequency discrete statistics table add?
The benefits of using the 2012 graphing categorical frequency discrete statistics table add include improved data visualization, enhanced analytical capabilities, and the ability to present complex data in an easily digestible format. This feature streamlines your workflow and boosts productivity.
-
Can I integrate the 2012 graphing categorical frequency discrete statistics table add with other tools?
Absolutely! The 2012 graphing categorical frequency discrete statistics table add can be seamlessly integrated with various tools and platforms. This flexibility allows you to enhance your existing workflows and leverage data from multiple sources.
-
How user-friendly is the 2012 graphing categorical frequency discrete statistics table add?
The 2012 graphing categorical frequency discrete statistics table add is designed with user-friendliness in mind. Its intuitive interface allows users of all skill levels to create and customize graphs and tables without extensive training or technical knowledge.
-
What types of data can I analyze with the 2012 graphing categorical frequency discrete statistics table add?
You can analyze various types of categorical data using the 2012 graphing categorical frequency discrete statistics table add. This includes survey results, demographic information, and any other data that can be categorized, allowing for comprehensive statistical analysis.
Get more for Blank Frequency Table
- Prior authorization drug attachment for anti obesity drugs form
- Reasons for prior authorization print form
- Wi department of health service form
- Dhs wisconsin form
- Demographic data patient information
- Dph 4151 form
- Fillable online policy name fees policy department finance form
- Wisconsin blood lead registry organization security and confidentiality agreement form
Find out other Blank Frequency Table
- How To Sign Texas Doctors PDF
- Help Me With Sign Arizona Education PDF
- How To Sign Georgia Education Form
- How To Sign Iowa Education PDF
- Help Me With Sign Michigan Education Document
- How Can I Sign Michigan Education Document
- How Do I Sign South Carolina Education Form
- Can I Sign South Carolina Education Presentation
- How Do I Sign Texas Education Form
- How Do I Sign Utah Education Presentation
- How Can I Sign New York Finance & Tax Accounting Document
- How Can I Sign Ohio Finance & Tax Accounting Word
- Can I Sign Oklahoma Finance & Tax Accounting PPT
- How To Sign Ohio Government Form
- Help Me With Sign Washington Government Presentation
- How To Sign Maine Healthcare / Medical PPT
- How Do I Sign Nebraska Healthcare / Medical Word
- How Do I Sign Washington Healthcare / Medical Word
- How Can I Sign Indiana High Tech PDF
- How To Sign Oregon High Tech Document