Using Graphs to Relate Two Quantities Form


What is the Using Graphs To Relate Two Quantities
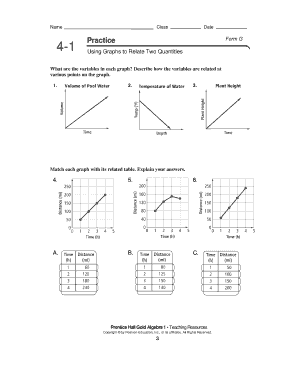
The form using graphs to relate two quantities is designed to visually represent the relationship between two distinct variables. This form is particularly useful in educational settings, where students can illustrate mathematical concepts through graphical representation. By plotting data points on a graph, users can analyze trends, make predictions, and better understand the correlation between the quantities involved. This method enhances comprehension and retention of information, making it an effective tool for both teaching and learning.
How to use the Using Graphs To Relate Two Quantities
To effectively use the form, begin by identifying the two quantities you wish to compare. Gather the relevant data and determine the appropriate scale for your graph. Next, plot the data points on a Cartesian plane, ensuring that each axis is clearly labeled with the corresponding quantity. Once the points are plotted, connect them to visualize the relationship. This graphical approach allows for easier interpretation of data trends and facilitates discussions on the implications of the findings.
Key elements of the Using Graphs To Relate Two Quantities
Several key elements are essential for effectively completing the form using graphs to relate two quantities. These include:
- Axes: Clearly defined axes that represent the two quantities being compared.
- Data Points: Accurate plotting of data points based on the collected information.
- Labels: Proper labeling of axes and data points to ensure clarity and understanding.
- Scale: An appropriate scale that accurately reflects the range of data being presented.
- Title: A descriptive title that summarizes the content of the graph.
Examples of using the Using Graphs To Relate Two Quantities
Examples of using graphs to relate two quantities can be found in various fields, including education, business, and science. For instance:
- Education: Students may use graphs to compare test scores over different periods, highlighting improvements or declines.
- Business: Companies can analyze sales data against marketing expenditures to determine the effectiveness of their strategies.
- Science: Researchers often graph temperature changes against time to study climate patterns.
Steps to complete the Using Graphs To Relate Two Quantities
Completing the form involves several steps:
- Identify the two quantities to be compared.
- Collect and organize the relevant data.
- Choose the appropriate graph type (e.g., line graph, bar chart).
- Label the axes and determine the scale.
- Plot the data points accurately on the graph.
- Connect the points (if applicable) and add a title.
- Review the graph for clarity and accuracy.
Legal use of the Using Graphs To Relate Two Quantities
The legal use of the form using graphs to relate two quantities is contingent upon adherence to educational standards and guidelines. In an academic context, it is essential to ensure that the data represented is accurate and sourced from credible references. Additionally, when used in business or research, compliance with relevant regulations regarding data presentation and privacy must be observed. Proper documentation and citation of sources are crucial to maintain integrity and legality in the use of this form.
Quick guide on how to complete using graphs to relate two quantities
Complete Using Graphs To Relate Two Quantities effortlessly on any device
Digital document management has become increasingly popular among businesses and individuals. It offers an ideal eco-friendly alternative to conventional printed and signed paperwork, allowing you to locate the correct form and securely store it online. airSlate SignNow provides all the tools necessary to create, modify, and eSign your documents swiftly without delays. Manage Using Graphs To Relate Two Quantities on any platform with airSlate SignNow's Android or iOS applications and simplify any document-related process today.
How to modify and eSign Using Graphs To Relate Two Quantities without hassle
- Locate Using Graphs To Relate Two Quantities and click Get Form to begin.
- Use the tools we offer to complete your form.
- Highlight pertinent sections of the documents or redact sensitive information with tools that airSlate SignNow specifically provides for that purpose.
- Generate your signature using the Sign tool, which takes seconds and holds the same legal authority as a traditional wet ink signature.
- Verify all the details and click the Done button to save your changes.
- Choose how you want to send your form: by email, SMS, invite link, or download it to your computer.
Put an end to lost or misplaced files, cumbersome form searching, or errors that necessitate printing new document copies. airSlate SignNow fulfills all your document management requirements with just a few clicks from any device you prefer. Edit and eSign Using Graphs To Relate Two Quantities to ensure excellent communication at every stage of the form preparation process with airSlate SignNow.
Create this form in 5 minutes or less
Create this form in 5 minutes!
How to create an eSignature for the using graphs to relate two quantities
How to create an electronic signature for a PDF online
How to create an electronic signature for a PDF in Google Chrome
How to create an e-signature for signing PDFs in Gmail
How to create an e-signature right from your smartphone
How to create an e-signature for a PDF on iOS
How to create an e-signature for a PDF on Android
People also ask
-
How can airSlate SignNow assist in using graphs to relate two quantities effectively?
airSlate SignNow provides a user-friendly interface that allows users to create visual representations, making it easier to understand relationships between quantities. By incorporating features like document templates and real-time collaboration, businesses can effectively visualize data and utilize graphs to relate two quantities.
-
What are the pricing options for airSlate SignNow when focusing on features like using graphs to relate two quantities?
airSlate SignNow offers various pricing plans to accommodate different business needs. These plans provide access to essential features, including document management and eSign capabilities, which are valuable for professionals using graphs to relate two quantities in their workflows.
-
Can I integrate airSlate SignNow with tools designed for using graphs to relate two quantities?
Yes, airSlate SignNow integrates seamlessly with various applications that specialize in data visualization and analysis. This allows users to connect their graphing tools, enhancing their ability to use graphs to relate two quantities alongside document management features.
-
What benefits does airSlate SignNow offer for businesses focused on using graphs to relate two quantities?
By using airSlate SignNow, businesses can streamline their document processes while simultaneously focusing on data visualization techniques. This combination enhances productivity and fosters better decision-making when analyzing relationships through graphs that relate two quantities.
-
Is airSlate SignNow suitable for educational purposes, especially for teaching using graphs to relate two quantities?
Absolutely! airSlate SignNow is a fantastic tool for educators who want to teach students about graphing and data relationships. The platform enables the creation of instructional materials that effectively demonstrate using graphs to relate two quantities in an engaging manner.
-
How does airSlate SignNow support team collaboration when using graphs to relate two quantities?
airSlate SignNow promotes collaborative efforts by enabling multiple users to work on documents simultaneously. This collaboration extends to data visualization projects where teams can share insights effectively while using graphs to relate two quantities.
-
What types of documents can I create with airSlate SignNow that utilize using graphs to relate two quantities?
With airSlate SignNow, users can create a variety of documents, including reports, proposals, and analysis sheets that feature graphs to relate two quantities. The platform's customizable templates allow for easy integration of various graphical elements tailored to specific needs.
Get more for Using Graphs To Relate Two Quantities
Find out other Using Graphs To Relate Two Quantities
- eSign Wyoming Real estate investment proposal template Free
- How Can I eSign New York Residential lease
- eSignature Colorado Cease and Desist Letter Later
- How Do I eSignature Maine Cease and Desist Letter
- How Can I eSignature Maine Cease and Desist Letter
- eSignature Nevada Cease and Desist Letter Later
- Help Me With eSign Hawaii Event Vendor Contract
- How To eSignature Louisiana End User License Agreement (EULA)
- How To eSign Hawaii Franchise Contract
- eSignature Missouri End User License Agreement (EULA) Free
- eSign Delaware Consulting Agreement Template Now
- eSignature Missouri Hold Harmless (Indemnity) Agreement Later
- eSignature Ohio Hold Harmless (Indemnity) Agreement Mobile
- eSignature California Letter of Intent Free
- Can I eSign Louisiana General Power of Attorney Template
- eSign Mississippi General Power of Attorney Template Free
- How Can I eSignature New Mexico Letter of Intent
- Can I eSign Colorado Startup Business Plan Template
- eSign Massachusetts Startup Business Plan Template Online
- eSign New Hampshire Startup Business Plan Template Online