Scatter Plot Assessment Form


What is the Scatter Plot Assessment
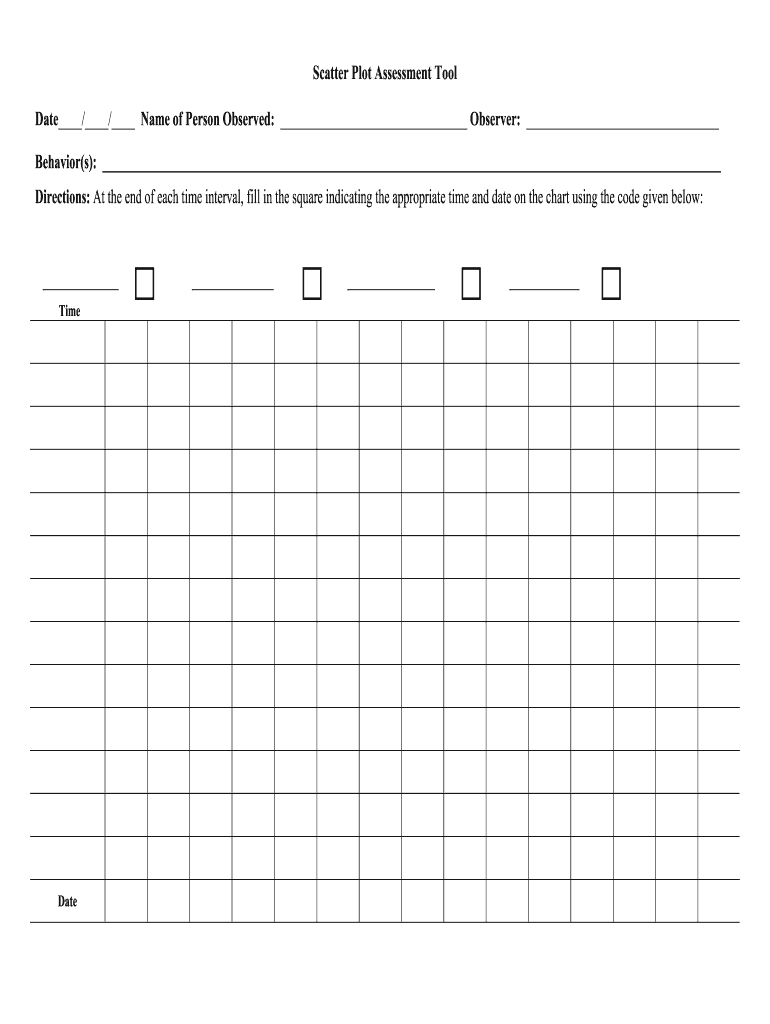
The scatter plot assessment is a valuable tool used to visually represent data points in relation to two variables. This method allows for the identification of patterns, trends, and correlations within the data. Typically utilized in educational and behavioral contexts, the scatter plot assessment can help educators and professionals analyze student behavior or performance over time. By plotting data points on a blank scatter plot graph, users can easily interpret complex information and make informed decisions based on visual insights.
How to use the Scatter Plot Assessment
Using the scatter plot assessment involves several straightforward steps. First, gather the relevant data that you wish to analyze. This may include variables such as time spent on a task and performance scores. Next, input this data into a blank scatter plot template, ensuring that each axis represents one of the variables. After plotting the data points, observe the distribution to identify any patterns or correlations. This visual representation can facilitate discussions and interventions based on the observed behavior or performance trends.
Steps to complete the Scatter Plot Assessment
Completing the scatter plot assessment requires careful attention to detail. Follow these steps for an effective assessment:
- Collect data relevant to the assessment, ensuring accuracy and completeness.
- Select a suitable blank scatter plot template for your analysis.
- Label the axes clearly, indicating the variables being measured.
- Plot each data point accurately on the graph.
- Analyze the plotted data to identify trends, clusters, or outliers.
- Document your findings and consider any necessary actions based on the analysis.
Key elements of the Scatter Plot Assessment
Several key elements contribute to the effectiveness of the scatter plot assessment. These include:
- Data Accuracy: Ensure that the data collected is precise and relevant to the assessment goals.
- Clear Labeling: Properly label the axes to avoid confusion during analysis.
- Consistent Scale: Use a consistent scale on both axes to accurately represent the data.
- Observation of Patterns: Focus on identifying patterns or relationships within the data points.
Legal use of the Scatter Plot Assessment
The legal use of the scatter plot assessment is essential, particularly in educational and behavioral contexts. It is important to adhere to relevant regulations and privacy standards when collecting and analyzing data. Ensure that any data used in the assessment complies with federal and state laws regarding student information and confidentiality. Additionally, obtaining consent from individuals or guardians when necessary can help maintain ethical standards in the assessment process.
Examples of using the Scatter Plot Assessment
Examples of using the scatter plot assessment can vary widely depending on the context. In educational settings, teachers may use it to track student performance over time, plotting test scores against study hours. In behavioral assessments, practitioners might analyze the frequency of specific behaviors against time spent in various activities. These examples illustrate the versatility of the scatter plot assessment in providing insights that can guide interventions and support.
Quick guide on how to complete scatter plot assessment tool date name of person observed
Discover how to smoothly navigate the Scatter Plot Assessment completion with this simple guide
Submitting and finishing documents online is becoming more prevalent and the preferred option for a diverse range of clients. It offers multiple advantages over traditional hard copies, such as convenience, time savings, improved accuracy, and security.
With tools like airSlate SignNow, you can access, modify, verify, enhance, and send your Scatter Plot Assessment without getting bogged down by endless printing and scanning. Follow this brief guide to begin and finalize your form.
Utilize these instructions to obtain and complete Scatter Plot Assessment
- Start by clicking on the Get Form button to open your document in our editor.
- Pay attention to the green label on the left that highlights required fields so you don’t miss them.
- Leverage our advanced features to annotate, modify, sign, secure, and enhance your document.
- Protect your file or convert it into a fillable form using the features available in the right panel.
- Review the document and inspect it for errors or inconsistencies.
- Hit DONE to complete editing.
- Change the name of your form or leave it as is.
- Select the storage service you wish to use for your document, send it via USPS, or click the Download Now button to save your document.
If Scatter Plot Assessment is not what you were seeking, you can explore our extensive array of pre-existing templates that you can complete with minimal effort. Try out our solution today!
Create this form in 5 minutes or less
FAQs
-
What’s the title of a person who can take a complex Excel spreadsheet and turn it into a user friendly, intuitive form that’s easy to fill out? How can I hire someone with those skills? It contains , financial, quoting & engineering data.
Look for an SaaS developer, someone with JavaScript, PHP, and MySQL skills to create Cloud-hosted browser-based forms and reports who also has a modicum of financial analysis background.Dumping obsolete Excel client server architecture as soon as you can will be the best thing you can do to bring your operation into the 21st Century.
Create this form in 5 minutes!
How to create an eSignature for the scatter plot assessment tool date name of person observed
How to generate an eSignature for your Scatter Plot Assessment Tool Date Name Of Person Observed in the online mode
How to make an electronic signature for the Scatter Plot Assessment Tool Date Name Of Person Observed in Google Chrome
How to make an eSignature for signing the Scatter Plot Assessment Tool Date Name Of Person Observed in Gmail
How to generate an eSignature for the Scatter Plot Assessment Tool Date Name Of Person Observed from your mobile device
How to generate an electronic signature for the Scatter Plot Assessment Tool Date Name Of Person Observed on iOS devices
How to make an electronic signature for the Scatter Plot Assessment Tool Date Name Of Person Observed on Android OS
People also ask
-
What is a Scatter Plot Assessment and how does it work?
A Scatter Plot Assessment is a visual representation used in data analysis to showcase the relationship between two variables. By plotting data points on a graph, it allows users to identify trends, correlations, and outliers in their data set. Using airSlate SignNow, you can easily integrate Scatter Plot Assessments into your document workflows, enhancing your data-driven decision-making.
-
How can I utilize Scatter Plot Assessments in my business?
You can utilize Scatter Plot Assessments to analyze customer behavior, sales trends, or any data that requires correlation analysis. By incorporating these assessments into your business reports, you can make informed decisions based on visual insights. airSlate SignNow streamlines this process by allowing you to create and share your assessments directly within your document management system.
-
Is there a cost associated with using Scatter Plot Assessments through airSlate SignNow?
The cost of using Scatter Plot Assessments through airSlate SignNow depends on the plan you choose. Our pricing is designed to be cost-effective, ensuring that businesses of all sizes can leverage the power of data visualization without breaking the bank. Check our pricing page for detailed information on features included at each tier.
-
What features does airSlate SignNow offer for Scatter Plot Assessments?
airSlate SignNow provides a range of features for Scatter Plot Assessments, including customizable templates, easy data input, and the ability to draw conclusions from visual data. Additionally, you can collaborate with team members in real-time, ensuring that insights from your assessments are shared and utilized effectively. Our platform makes creating and managing these assessments straightforward and efficient.
-
Can I integrate Scatter Plot Assessments with other tools?
Yes, airSlate SignNow allows for seamless integration with various tools and platforms, enabling you to enhance your Scatter Plot Assessments. Whether you’re using CRM systems, project management tools, or data analytics software, our integrations help you maximize efficiency and productivity. This flexibility allows you to easily incorporate your assessments into your existing workflows.
-
How does airSlate SignNow enhance the accuracy of my Scatter Plot Assessments?
airSlate SignNow enhances the accuracy of your Scatter Plot Assessments by providing reliable data entry and document management features. With our platform, you can minimize errors by automating data collection and ensuring that your inputs are consistent. This leads to more accurate visualizations and better insights derived from your assessments.
-
What are the benefits of using Scatter Plot Assessments for my team?
Using Scatter Plot Assessments can signNowly benefit your team by providing clear visual insights into complex data sets. This helps in identifying patterns and making data-driven decisions quickly. Additionally, airSlate SignNow's collaborative features allow team members to discuss findings and strategies based on the assessments, fostering a data-centric culture within your organization.
Get more for Scatter Plot Assessment
- Illinois notice default 497305971 form
- Notice default contract form
- Assignment of contract for deed by seller illinois form
- Notice of assignment of contract for deed illinois form
- Contract for sale and purchase of real estate with no broker for residential home sale agreement illinois form
- Buyers home inspection checklist illinois form
- Sellers information for appraiser provided to buyer illinois
- Legallife multistate guide and handbook for selling or buying real estate illinois form
Find out other Scatter Plot Assessment
- How To Integrate Sign in Banking
- How To Use Sign in Banking
- Help Me With Use Sign in Banking
- Can I Use Sign in Banking
- How Do I Install Sign in Banking
- How To Add Sign in Banking
- How Do I Add Sign in Banking
- How Can I Add Sign in Banking
- Can I Add Sign in Banking
- Help Me With Set Up Sign in Government
- How To Integrate eSign in Banking
- How To Use eSign in Banking
- How To Install eSign in Banking
- How To Add eSign in Banking
- How To Set Up eSign in Banking
- How To Save eSign in Banking
- How To Implement eSign in Banking
- How To Set Up eSign in Construction
- How To Integrate eSign in Doctors
- How To Use eSign in Doctors