Biophysical Journal
Volume 75
December 1998
2877–2887
2877
Total Lipids with Short and Long Acyl Chains from Acholeplasma Form
Nonlamellar Phases
Ann-Sofie Andersson, Leif Rilfors, Greger Orädd, and Göran Lindblom
Department of Physical Chemistry, Umeå University, S-901 87 Umeå, Sweden
ABSTRACT The cell-wall-less bacterium Acholeplasma laidlawii A-EF22 synthesizes eight glycerolipids. Some of them form
lamellar phases, whereas others are able to form normal or reversed nonlamellar phases. In this study we examined the phase
properties of total lipid extracts with limiting average acyl chain lengths of 15 and 19 carbon atoms. The temperature at which
these extracts formed reversed hexagonal (HII) phases differed by 5–10°C when the water contents were 20 –30 wt%. Thus
the cells adjust the ratio between lamellar-forming and nonlamellar-forming lipids to the acyl chain lengths. Because short acyl
chains generally increase the potential of lipids to form bilayers, it was judged interesting to determine which of the A. laidlawii
A lipids are able to form reversed nonlamellar phases with short acyl chains. The two candidates with this ability are
monoacyldiglucosyldiacylglycerol (MADGlcDAG) and monoglucosyldiacylglycerol. The average acyl chain lengths were 14.7
and 15.1 carbon atoms, and the degrees of acyl chain unsaturation were 32 and 46 mol%, respectively. The only liquid
crystalline phase formed by MADGlcDAG is an HII phase. Monoglucosyldiacylglycerol forms reversed cubic (Ia3d) and HII
phases at high temperatures. Thus, even when the organism is grown with short fatty acids, it synthesizes two lipids that have
the capacity to maintain the nonlamellar tendency of the lipid bilayer. MADGlcDAG in particular contributes very powerfully
to this tendency.
INTRODUCTION
Currently there is great interest in the phase behavior of
membrane lipids. One of our main interests concerns the
presence and function of so-called nonlamellar-forming lipids in cell membranes. This issue can be conveniently
studied using prokaryotic organisms, like Acholeplasma
laidlawii and Escherichia coli (Morein et al., 1996; Rietveld
et al., 1993; Rilfors et al., 1993). A. laidlawii in particular is
suitable, because the organism lacks a cell wall and possesses only a cytoplasmic membrane. In addition, A. laidlawii can be grown in media that permit the acyl chain
composition of its lipids to be manipulated. For the cells to
cope with acyl chain variations, the polar headgroup composition in A. laidlawii A is regulated in a coherent way
(Andersson et al., 1996; Rilfors et al., 1993). Generally, the
fraction of the lipids forming reversed nonlamellar structures increases when the length and the unsaturation of the
acyl chains are reduced. The regulation of the ratio between
the lipids forming lamellar and nonlamellar phases is expected to yield phase transition temperatures from a lamellar to a nonlamellar phase (TNL) within a rather narrow
interval for total lipid extracts (Lindblom et al., 1986; Niemi
et al., 1997; Osterberg et al., 1995; Rilfors et al., 1994). In
those studies the average acyl chain lengths (Cn) of the total
lipid extracts were in the range of 16 –18 carbon atoms.
However, A. laidlawii A can be forced to have lipids with
Received for publication 15 October 1997 and in final form 3 August 1998.
Address reprint requests to Dr. Ann-Sofie Andersson, Department of
Physical Chemistry, Umeå University, S-901 87 Umeå, Sweden. Tel.:
146-90-7866576; Fax.: 146-90-7867779; E-mail: annsofie.andersson@
chem.umu.se.
© 1998 by the Biophysical Society
0006-3495/98/12/2877/11 $2.00
Cn values between 14.5 and 20 carbon atoms (Wieslander et
al., 1995). From studies of synthetic lipids it is well established that such a large difference in chain length has a
dramatic impact on the TNL values (Koynova and Caffrey,
1994; Mannock et al., 1990; Sen et al., 1990).
The questions we ask in this study are: 1) Are the cells
able to maintain TNL of the total lipids within a narrow
range at the limiting Cn values? 2) Which lipids are responsible for the nonlamellar tendencies at these Cn values? For
this purpose A. laidlawii A was grown in media supplemented with the shortest and longest fatty acids possible for
growth, and the phase behavior of the extracted total lipids
was investigated to answer the first question.
The lipids with the capacity to form reversed nonlamellar
phases in A. laidlawii A are 1,2-diacyl-3-O-(a-D-glucopyranosyl)-sn-glycerol (MGlcDAG), 1,2-diacyl-3-O-[6-Oacyl-(a-D-glucopyranosyl)]-sn-glycerol (MAMGlcDAG),
and 1,2-diacyl-3-O-[a-D-glucopyranosyl-(1 3 2)-O-(6-Oacyl-a-D-glucopyranosyl)]-sn-glycerol
(MADGlcDAG)
(Andersson et al., 1996; Lindblom et al., 1986, 1993; Niemi
et al., 1995). It is well known that long acyl chains shift the
phase equilibria toward nonlamellar phases, and therefore
the important balance between lamellar-forming and nonlamellar-forming lipids is obviously maintained when A.
laidlawii A is grown with long chain fatty acids. However,
it is still unknown whether any lipid with short acyl chains
in this organism is able to form nonlamellar phases close
to physiological temperatures. It has been observed that
MGlcDAG and MADGlcDAG are present in short-chain
lipid extracts (Andersson et al., 1996), and the phase behavior of these lipids was studied in this work to answer the
second question. We anticipate that MADGlcDAG will play
an important role in this regulation process.
�2878
Biophysical Journal
MATERIALS AND METHODS
Cell growth
Strain A-EF22 of A. laidlawii was grown in a lipid-depleted bovine serum
albumin/tryptose medium (Andersson et al., 1996). Twenty liters of the
medium was supplemented with 75 mM a-deuterated myristic acid (14:0d2) and 75 mM palmitoleic acid (16:1c), and 5 l of the medium was
supplemented with 120 mM a-deuterated arachidic acid (20:0-d2) and 30
mM a-deuterated oleic acid (18:1c-d2). a-Deuterated oleic acid (18:1c-d2)
was synthesized according to the method of Tulloch (1977), and 14:0-d2
and 20:0-d2 were obtained from Larodan Fine Chemicals (Malmö, Sweden). The cells were grown at 37°C and adapted to the two fatty acid pairs
by at least five consecutive daily inoculations. The final two inoculations
were 5% (v/v), and the time of growth was 20 6 1 h. The cell cultures were
harvested as described by Andersson et al. (1996).
Lipid extraction
The membrane lipids were extracted and purified as described previously
(Andersson et al., 1996). Divalent cations were removed from the total
lipid extracts and exchanged for sodium ions by a modified version (Rilfors
et al., 1994) of the procedure described by Smaal and colleagues (1985).
This procedure was only performed on 120 mg of the total lipid extract
isolated from the cells supplemented with 14:0-d2 and 16:1c (see next
section).
Purification of MGlcDAG and MADGlcDAG
MGlcDAG and MADGlcDAG were purified from the lipid extracts isolated from the cell cultures supplemented with 14:0-d2 and 16:1c. The
remainder of the total lipid extract (see previous section) was applied to a
silica gel (Silica gel S, 230 – 400 mesh; Riedel-de Häen, Seelze, Germany)
column. A slight N2 pressure was maintained over the column to prevent
oxidation of the lipids. Pigments and neutral lipids were eluted with
chloroform, and the glucolipids with acetone. The acetone fractions, which
mainly contained MGlcDAG and MADGlcDAG, were selected and applied to preparative thin-layer chromatography (TLC) plates to separate the
two lipids (Hauksson et al., 1995). The glucolipids were eluted from the gel
as described previously (Lindblom et al., 1986). Divalent cations were
removed from the purified lipids and exchanged for sodium as described in
the previous section.
Determination of lipid composition
The acyl chain distributions in the two glucolipids and the total lipid
extracts were determined by gas-liquid chromatography after converting
the acyl chains to their methyl esters (Rilfors et al., 1978). The analyses of
the methyl esters and the calculations of the molar percentages were
performed as in Andersson et al. (1996).
The polar headgroup distribution in the total lipid extracts were analyzed with high-performance liquid chromatography (HPLC), by a modified version (Andersson et al., 1996) of the procedure described by Arnoldsson and Kaufmann (1994). A mixture of MGlcDAG, MAMGlcDAG,
1,2-diacyl-3-O-[a-D-glucopyranosyl-(1 3 2)-O-a-D-glucopyranosyl]-snglycerol (DGlcDAG), 1-palmitoyl-2-oleoyl-sn-glycero-3-phosphoglycerol
(POPG), and 1,2-diacyl-3-O-[glycerophosphoryl-6-O-(a-D-glucopyranosyl-(1 3 2)-O-a-D-glucopyranosyl)]-sn-glycerol (GPDGlcDAG) was analyzed to determine their molar response factors. POPG was obtained from
Avanti Polar Lipids (Birmingham, AL), and a preparation of MAMGlcDAG from Lindblom et al. (1993) was used. The preparations of DGlcDAG and GPDGlcDAG used were from Andersson et al. (1996). The
molar response factors were determined for each of the five lipids, and by
interpolation the response factors for MADGlcDAG and 1,2-diacyl-3-O[glycerophosphoryl-6-O-(a-D-glucopyranosyl-(1 3 2)-monoacylglycerophosphoryl-6-O-a-D-glucopyranosyl)]-sn-glycerol (MABGPDGlcDAG)
Volume 75
December 1998
were determined from a plot of response factors versus retention time. The
fraction designated 1,2-diacylglycerol (DAG) contains 75–95 mol% of
DAG, the remainder being mainly free fatty acids and probably some
pigments (Wieslander et al., 1995). Therefore, this fraction is presented as
area % values in Table 2. To determine the approximate mol% values, the
molar response factor for this fraction was estimated by extrapolation,
using the plot of response factors versus retention time. The peaks in the
chromatogram were assigned by comparing their retention times with those
of the purified A. laidlawii lipids, and the molar percentages were calculated from the obtained molar response factors.
The purity of the MGlcDAG and MADGlcDAG preparations was
determined by HPLC and TLC (Andersson et al., 1996). The purity was
determined by TLC to be $99% for MGlcDAG and $90% for MADGlcDAG; the contaminant in the latter preparation was mainly MGlcDAG.
HPLC could not detect any impurities in the MGlcDAG preparation,
whereas the MADGlcDAG preparation contained 3.8 mol% MGlcDAG.
Preparation of lipid samples for NMR and
x-ray studies
The lipids (20 –30 mg) were dried to a film in an 8-mm outer diameter glass
tube with N2 and then dried to constant weight in vacuum. After the
addition of 20, 30 or 40 wt% water, the tubes were centrifuged and
flame-sealed. Deuterium-depleted water (1H2O) (Fluka, Buchs, Switzerland) or deuterium oxide (Cambridge Isotope Laboratories, Woburn, MA)
was used for the 2H NMR studies and the diffusion measurements, respectively. The samples were mixed by extended centrifugation and freezethawed for 10 cycles to ensure complete equilibration.
2
H-NMR measurements and data processing
2
H-NMR spectra were obtained for the lipid samples at a frequency of
76.77 MHz on a Bruker AMX2–500 spectrometer. A selective 2H highpower probe with an 8-mm horizontal solenoid coil (500/8/X; Cryomagnetic Systems, Indianapolis, IN) was used. A phase-cycled quadrupole
echo pulse sequence was used (Davis et al., 1976), with a p/2 pulse length
of 6.4 ms and a 40-ms pulse separation. A total of 20,000 –25,000 scans
were collected for each temperature, with a recycle time of 0.15 s. The
temperature was controlled with a Eurotherm B-VT 2000 unit and checked
by a second thermocouple placed close to the sample. A temperature
calibration was made on the standard settings, from which the desired
temperatures were calculated. Each temperature increment was 2.5°C and
was kept for 30 min, i.e., the sample had 30 min of equilibration time
before the acquisition started. The data processing was performed according to the method of Andersson et al. (1996). To determine the fractions of
the phases present in the MGlcDAG samples, simulations of the spectra
were performed with the FTNMR program (Hare Research). No decomposition of the lipids was observed according to the TLC analyses performed after the measurements. The phase transitions can be conveniently
followed from a measurement of the NMR quadrupole splittings as a
function of temperature and composition (Lindblom, 1996).
NMR diffusion measurements
The self-diffusion coefficient of MGlcDAG in the cubic liquid crystalline
phase was determined with the Fourier-transform pulsed magnetic field
gradient spin-echo technique (Lindblom and Orädd, 1994; Stejksal and
Tanner, 1965; Stilbs, 1987). A Hahn-echo sequence (p/2–t–p–t–acquisition) was used to refocus the magnetization.
The diffusion experiments were performed at 55°C on a Chemagnetics
CMX-100 spectrometer equipped with a HP-90 proton diffusion goniometer probe (Cryomagnet Systems, Indianapolis, IN). The magnet gradient
pulses were generated by a home-built gradient unit driven by a Kenwood
PD35–20D power supply.
The gradient pulses of rectangular shape with duration d and strength g
were applied on each side of the 180° pulse with a separation of D 5 t. In
�Andersson et al.
TABLE 1
Short-Chain Lipids Form Nonlamellar Phases
2879
Acyl chain composition in the total lipid extracts and purified glucolipids from A. laidlawii A-EF22
Acyl chain# composition (mol%)
Fatty acid supplement
to growth medium*
Lipid
12:0
13:0
14:0
15:0
16:0
16:1c
18:0
18:1c
20:0
ND§
Cn¶
UAC\
20:0-d2/18:1c–d2 (4:1)
14:0-d2/16:1c (1:1)
14:0-d2/16:1c (1:1)
14:0-d2/16:1c (1:1)
Total lipid extract**
Total lipid extract**
MGlcDAG
MADGlcDAG
0.3
0.4
0.2
1.4
0.6
0.4
0.4
0.9
1.9
51
48
62
0.8
0.2
0.2
0.2
2
1.2
1.2
1.3
0.3
41.6
46.2
31.7
0.3
0.4
0.5
0.1
30.6
—
—
—
63
1.5
0.3
—
—
3.6
3.2
2.3
19.1
15.1
15.1
14.7
30.9
41.6
46.2
31.7
*The total concentration of the fatty acids supplemented to the growth medium was 150 mM.
#
Fatty acids and acyl chains are denoted as n:k, where n is the number of carbons and k is the number of cis double bonds.
§
Not determined or acyl chains in minor amounts.
¶
Average acyl chain length.
\
Unsaturated acyl chains (mol%).
**The degrees of incorporation of the exogenously supplied fatty acids into the membrane lipids were $92 mol%, the remainder being synthesized by the
organism.
addition, the diffusion experiments were performed by varying d while
keeping the other parameters constant. The experimental parameters were
t 5 D 5 100 ms, d 5 1–20 ms, g 5 0.958 T/m.
X-ray diffraction
The x-ray measurements of MADGlcDAG and MGlcDAG were performed
at Station 8.2 at the Daresbury Laboratory (Cheshire, England) with a
monochromatic beam of wavelength 1.5 Å. This station provides the
possibility of simultaneously measuring small-angle (SAXS) and wideangle (WAXS) x-ray scattering (Bras et al., 1993). The sample-to-detector
distance for the SAXS experiment was 1.5 m. SAXS data were calibrated
against a sample of wet rat tail collagen, and the WAXS data were
calibrated using ice peaks from frozen samples. Immediately before the
diffraction experiments were performed, the samples were placed between
mica sheets held by copper spacers. The sample temperatures were thermostatically controlled by mounting the samples on a modified microscope
cryostage (Linkam, England) and monitored with a thermocouple embedded in the sample adjacent to the beam.
Starting at 25°C, the temperature was decreased at a rate of 3°C/min to
225°C and then raised at the same rate up to ;60°C. At certain intervals
the temperature was held at a constant value for several minutes to ensure
sample equilibration. No change in the diffractograms was observed during
these constant temperature periods, and it was concluded that the sample
was close to thermal equilibrium at all times. The gel phase was recognized
from the sharp WAXS reflection around 5 Å. The SAXS reflections were
used to distinguish the liquid crystalline phases (Seddon, 1990). After the
measurements, the lipids were removed from the mica sheets and checked
with TLC to make sure that no decomposition of the lipids had occurred.
RESULTS
et al., 1995). The phase behavior of total lipid extracts with
acyl chain compositions near the chain length boundaries of
this “growth window” has been determined in the present
study (Table 1).
A. laidlawii A regulates its polar headgroup composition
of the membrane lipids according to the prevailing growth
conditions (Andersson et al., 1996; Rilfors et al., 1993;
Wieslander et al., 1980). The polar headgroup compositions
in the total lipid extracts are presented in Table 2. The
relative amounts of each lipid are consistent with earlier
studies (Andersson et al., 1996). An important point to make
is that the fraction of the lipids with a potential to induce
the formation of reversed nonlamellar phases (DAG,
MGlcDAG, MAMGlcDAG, and MADGlcDAG) is larger in
the short-chain total lipid extract. However, the difference
in this fraction between the total lipid extracts is most
probably even larger than that seen in Table 2, because the
lipid fraction designated DAG is overestimated by the area
% values. The DAG fraction has the shortest HPLC retention time (Andersson et al., 1996), yielding a very low value
of the molar response factor. By using an extrapolated
response factor (see Materials and Methods) the area %
value for DAG in the long-chain total lipid extract is converted to 17 mol%. This value is reasonable, because it was
found in a previous study that the DAG fraction constituted
15–20 mol% for total lipid extracts with a Cn ' 18 and 30
mol% unsaturated acyl chains (Wieslander et al., 1995).
Composition of A. laidlawii lipids
A “growth window,” defined by the length and the degree of
cis-monounsaturation of the supplemented fatty acids, has
been established for A. laidlawii strain A-EF22 (Wieslander
TABLE 2
Phase equilibria of A. laidlawii total lipid extracts
The phase equilibria of total lipid extracts from A. laidlawii
A with Cn values of ;15 and ;19 carbon atoms were
Polar headgroup composition (mol%) in the total lipid extracts from A. laidlawii A-EF22
Fatty acid supplement
to growth medium*
20:0-d2/18:1c–d2 (4:1)
14:0-d2/16:1c (1:1)
Lipid# (mol%)
DAG
MGlcDAG
MAMGlcDAG
DGlcDAG
MADGlcDAG
PG
GPDGlcDAG
MABGPDGlcDAG
§
8.3
53.7
0.3
—
32.5
6.9
0.9
6.3
11.5
9.2
10.9
9.6
0.8
13.4
34.8 (17)
0.4§
*The total concentration of the fatty acids supplemented to the growth medium was 150 mM.
For abbreviations, see main text.
§
This lipid is presented in area %; see Results.
#
�2880
Biophysical Journal
Volume 75
December 1998
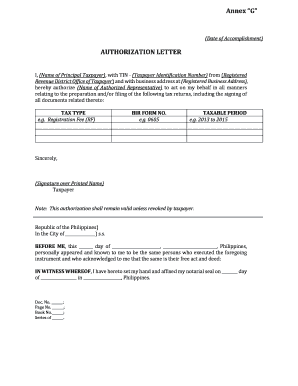
FIGURE 1 2H-NMR spectra of total membrane lipids extracted from A. laidlawii A-EF22 cells supplemented with 75/75 (mM/mM) 14:0-d2/16:1c. The
lipid extract contained the neutral lipids. (A) Sample 1 in Table 3, 20 wt% 1H2O. (B) Sample 3 in Table 3, 30 wt% 1H2O. (C) Sample 4 in Table 3, 40 wt%
1
H2O.
examined by 2H-NMR for three different water concentrations (20, 30, and 40 wt% 1H2O). Figs. 1 and 2 show the
2
H-NMR spectra of the total lipid extracts containing short
and long acyl chains, respectively. The spectra recorded
from the short-chain total lipid extract with 20 wt% water
are presented in Fig. 1 A. At 35°C the magnitude of the
quadrupole splittings (DnQ) indicates the presence of an La
phase (dominating splitting with DnQ ' 22 kHz). At 40°C
additional splittings of less than half the magnitude compared to those originating from an La phase are observed
(dominating splitting with DnQ ' 8 kHz). The transition
from an La phase to a reversed hexagonal liquid-crystalline
(HII) phase yields a reduction of the quadrupole splittings by
a factor of ;2 or more in a 2H-NMR spectrum, as a result
of an additional averaging by the translational diffusion
around the symmetry axis of the water cylinders and more
flexible chains in the HII phase (Lindblom, 1996). Thus a
transition from an La to an HII phase occurred around 40°C,
according to Fig. 1 A. In Fig. 1 B the spectra for the same
total lipid extract with 30 wt% water are shown. Using the
same reasoning as for Fig. 1 A, the magnitude of DnQ
indicates the presence of an La phase up to 45°C, whereas
components corresponding to an HII phase appear at 50°C.
In Fig. 1 C, where the water content was 40 wt%, an La
phase is present up to 60°C, whereas at 65°C a narrow
signal is observed to be superimposed on the spectra originating from La and HII phases. The narrow signal is an
indication of a cubic phase in which fast isotropic motion
occurs. The spectra recorded from the long-chain total lipid
extract with 20 wt% water are presented in Fig. 2 A. At
40°C the magnitude of DnQ in the spectrum indicates the
presence of an La phase, whereas at 45°C components
corresponding to an HII phase have emerged. In Fig. 2 B
spectra from the long-chain total lipid extract with 30 wt%
water are shown. The spectrum recorded at 45°C indicates
that an La phase is present, whereas at 50°C components
arising from an HII phase are observed. Finally, in Fig. 2 C
the water content of the sample was 40 wt% and an La
phase is present up 50°C, whereas at 55°C an HII phase
starts to form. The 2H-NMR spectra recorded from the other
samples were interpreted in an analogous way, and the
temperatures at which an HII and/or a reversed cubic phase
FIGURE 2 2H-NMR spectra of total membrane lipids extracted from A. laidlawii A-EF22 cells supplemented with 120/30 (mM/mM) 20:0-d2/18:1c-d2.
The lipid extract contained the neutral lipids. (A) Sample 6 in Table 3, 20 wt% 1H2O. (B) Sample 7 in Table 3, 30 wt% 1H2O. (C) Sample 10 in Table 3,
40 wt% 1H2O.
�Andersson et al.
Short-Chain Lipids Form Nonlamellar Phases
first appeared in the 2H-NMR spectra are summarized as
TNL values in Table 3. The reproducibility of the phase
equilibria was checked by investigating duplicate samples
and/or by remeasurements.
The TNL value increases with increasing water concentration for both total lipid extracts (Figs. 1 and 2 and Table
3). The change from 20 to 40 wt% water resulted in an
increase in the TNL values of ;25°C and ;5–10°C for the
lipids with short and long acyl chains, respectively. This
entails that the TNL value is slightly lower for the shortchain lipids than for the long-chain lipids when the water
content is 20 wt%, but the value is higher for the former
lipid extract when the water content is 40 wt%. Another
difference between the two lipid extracts is that the longchain lipids with 40 wt% water form La and HII phases at
high temperatures, whereas the short-chain lipids form an III
phase in addition to the La and HII phases under these
conditions (Figs. 1 C and 2 C). The fraction of the cubic
phase formed in the short-chain extract with 40 wt% water
is estimated to be 10 –15%. Finally, the values of the quadrupole splittings are larger for the short-chain lipids than for
the long-chain lipids, which is in accordance with former
studies (Monck et al., 1992; Thurmond et al., 1994).
Phase equilibria of MADGlcDAG and MGlcDAG
Short-chained MADGlcDAG (Table 1) with 20 wt% water,
corresponding to 14.9 mol of 1H2O/mol of lipid, was investigated with 2H-NMR and x-ray diffraction. It
can be inferred from Fig. 3 that the 2H-NMR spectra of
MADGlcDAG exhibit a very broadened signal at temperatures up to 40 – 45°C, whereas well-resolved quadrupole
splittings are observed at higher temperatures. The magnitude of the splittings is approximately half of the value of
the splittings emanating from an La phase and is equal in
magnitude to the splittings originating from an HII phase (cf.
Fig. 1). This strongly indicates that MADGlcDAG forms an
HII phase, and Fig. 3 illustrates that the HII phase remains up
2881
FIGURE 3 2H-NMR spectra of MADGlcDAG with an acyl chain composition given in Table 1. The water concentration of the sample was
20 wt%.
to the highest temperature investigated (60°C). The 2H-NMR
results are in good agreement with the x-ray diffraction
experiments. The latter showed that the last traces of a
lamellar gel (Lb) phase disappear at 41°C, and only reflections originating from an HII phase were detected up to
60°C (Fig. 4). Moreover, x-ray diffraction showed that the
HII phase is present together with the Lb phase at temperatures as low as 222°C. The lattice parameters for the
phases formed by MADGlcDAG are presented in Table 4.
Fig. 5 presents some 2H-NMR spectra recorded from
short-chained MGlcDAG (Table 1). At 10 wt% water, corresponding to 4.3 mol of 1H2O/mol of lipid, an La phase is
present at 25°C, and an isotropic component arises in the
spectra at higher temperatures. This latter component is
caused by an III phase (see x-ray diffraction results). The III
phase is the only phase present at 50°C, but when the
temperature has reached 55– 60°C an HII phase is in equi-
TABLE 3 The transition temperature (TNL) from a lamellar
liquid crystalline (La) to a reversed nonlamellar phase in total
lipid extracts isolated from A. laidlawii A-EF22
Total lipid extract with
Cn* 5 15.1 and
UAC# 5 41.6
Water content
TNL
Sample
TNL
§
30 wt% 1H2O
1
2
3§
37.5 6 2.5°C
32.5 6 2.5°C
47.5 6 2.5°C
40 wt% 1H2O
4§
62.5 6 2.5°C
5
6§
7§
8
9
10§
42.5 6 2.5°C
42.5 6 2.5
47.5 6 2.5°C
52.5 6 2.5°C
47.5 6 2.5°C
52.5 6 2.5°C
1
20 wt% H2O
Sample
Total lipid extract with
Cn 5 19.1 and
UAC 5 30.9
The lipid extracts contained the neutral lipids.
*Average acyl chain length.
#
Unsaturated acyl chains (mol%).
§
The 2H-NMR spectra of samples 1, 3, and 4 and of samples 6, 7, and 10
are presented in Figs. 1 and 2, respectively.
FIGURE 4 X-ray powder diffraction patterns obtained from MADGlcDAG with 20 wt% water. The acyl chain composition of MADGlcDAG
is given in Table 1. At 35°C, the reflections arising from the gel phase are
marked by a star and those from the HII phase by a plus sign.
�2882
Biophysical Journal
TABLE 4 Lattice parameters in the HII (a) and the Lb (d)
phases of the short-chain MADGlcDAG sample containing 20
wt% water at three temperatures
T (°C)
a* (Å)
d# (Å)
27.5
67.9
58.7
35
63.5
58.1
45
60
—
The acyl chain composition of MADGlcDAG is given in Table 1.
*The distance between the cylinder axes in the HII phase.
#
The lamellar repeat distance in the Lb phase.
librium with the III phase. At 20 wt% water, corresponding
to 9.8 mol of 1H2O/mol of lipid, MGlcDAG forms an La
phase in equilibrium with an III phase at temperatures between 25 and 55°C, whereas a further increase in the temperature to 60°C results in the formation of only an III
phase.
X-ray diffraction experiments on short-chained MGlcDAG with 20 wt% water shed further light on the phase
equilibria exhibited by this lipid. In the cooling mode starting at 24°C, reflections from three phases were observed,
namely, III, La, and crystalline/gel phases. However, only
one reflection from the cubic phase was observed. Below
216°C the reflections from the La phase were absent, and
only the gel phase could be detected. In the subsequent
heating mode the La phase appeared at 27°C, and a weak
reflection from the III phase appeared at ;32°C. When the
temperature was raised, more reflections belonging to the
cubic phase appeared, and the gel phase disappeared completely at 40°C. At the highest temperature investigated
Volume 75
December 1998
with x-ray diffraction (57°C), traces of the La phase could
still be detected (Fig. 6). The reflections from the cubic
phase were indexed according to the body-centered space
group Ia3d, and the validity of the indexing can be judged
from the straight line passing through the origin of coordinates in the plot of 1/d versus (h2 1 k2 1 l2)1/2 (Fig. 7).
From the slope, the unit cell dimension can be calculated to
be equal to 115 Å (Table 5).
The translational diffusion coefficient of the lipids in a
cubic phase can be used to distinguish between a bicontinuous one from a cubic phase composed of closed aggregates
(Lindblom and Orädd, 1994). The translational diffusion
coefficient for MGlcDAG in the III phase with 20 wt%
water at 55°C was determined in a pulsed field gradient
NMR experiment to be 3.4 3 10212 m2/s.
DISCUSSION
Our major purpose in this study is to determine which lipids
in a short-chain total lipid extract are able to form reversed
nonlamellar phases and if they have the potential to induce
such phases in total lipid extracts. Therefore, the discussion
will first deal with the phase behavior of MGlcDAG and
MADGlcDAG having short acyl chains. Subsequently, we
will discuss the phase behavior of short- and long-chain
total lipid extracts and relate these results to our model for
the regulation of the lipid composition in the membrane of
A. laidlawii A.
Phase properties of MADGlcDAG
In the previous phase studies of MADGlcDAG from A.
laidlawii A, the acyl chains were ;1.6 carbon atoms longer
and ;30 mol% more unsaturated (Andersson et al., 1996)
than the chains of the corresponding lipid investigated in
this work. In accordance with the earlier study, only one
liquid crystalline phase, namely the HII phase, was obtained
above the chain melting temperature. Because MADGlcDAG with very short and more saturated acyl chains also
FIGURE 5 2H-NMR spectra of MGlcDAG with an acyl chain composition given in Table 1. (A) 10 wt% 1H2O. The fractions of the two phases
at 55 and 60°C were obtained from simulations of the spectra and were
estimated to be 32% HII and 68% III at 55°C, and 58% HII and 42% III at
60°C. (B) 20 wt% 1H2O. The fractions of the two phases at 45°C were
estimated to be 85% La and 15% III.
FIGURE 6 X-ray powder diffraction pattern obtained from the cubic
phase formed by MGlcDAG with 20 wt% water at 57°C. The acyl chain
composition is presented in Table 1. The reflection marked by a star
originates from a small amount of La phase. The magnification shown is 10
times the original diffraction pattern.
�Andersson et al.
Short-Chain Lipids Form Nonlamellar Phases
FIGURE 7 Plot of 1/d versus (h2 1 k2 1 l2)1/2 of the reflections obtained
in the x-ray diffractogram (Fig. 6) recorded from the cubic phase formed
by MGlcDAG. The water concentration of the sample was 20 wt%, and the
temperature was 57°C.
forms an HII phase, this convincingly shows that it has a
large potential to form nonlamellar phases.
The distance between the cylinder axes (a) for MADGlcDAG in the HII phase was found to be considerably larger
for the short-chain MADGlcDAG (a 5 70 Å) than for
MADGlcDAG with longer acyl chains (a 5 57 Å) (Andersson et al., 1996). However, the opposite difference in a
would be expected, considering the effect of the chain
length only, because it has been observed for the saturated
species of synthetic MGlcDAG, 1,2-O-diacyl-3-O-b-Dgalactosyl-sn-glycerol (b-MGalDAG), and PE that a increases by ;2– 8 Å in the HII phase with an increment of the
acyl chain length of two carbons (Mannock and McElhaney,
1991; Seddon et al., 1984; Sen et al., 1990). The larger value
of a for the short-chain MADGlcDAG is therefore most
probably owing to its higher degree of acyl chain saturation
compared to the previously studied MADGlcDAG. Support
for this assertion comes from a comparison of a for two
MGlcDAG preparations with a Cn value of ;17, but with
different unsaturation; a ' 67– 68 Å for the saturated preparation, whereas a 5 49 Å for a preparation with 58 mol%
unsaturated acyl chains (Andersson et al., 1996; Sen et al.,
1990). A reduction in a of a similar magnitude has been
observed for b-MGalDAG when saturated acyl chains are
exchanged for mainly polyunsaturated acyl chains of the
same chain length (Mannock and McElhaney, 1991; Sen et
al., 1981; Shipley et al., 1973).
Phase properties of MGlcDAG
The phase equilibria of some MGlcDAG preparations with
medium chain lengths isolated from A. laidlawii strain A
have been determined in earlier studies (Andersson et al.,
1996; Lindblom et al., 1986). Dioleoyl-MGlcDAG
(DOMGlcDAG) forms only III and HII phases above 10°C
at water concentrations between ;1 and 15 wt%, and above
;15 wt% only the HII phase is formed (Lindblom et al.,
1986). The MGlcDAG prepared by Andersson et al. (1996)
had Cn 5 16.9 and 58 mol% unsaturated acyl chains. This
preparation formed mainly III and HII phases above 30°C.
2883
The present study of MGlcDAG with Cn 5 15.1 and 46
mol% unsaturated acyl chains shows that this lipid forms
mainly an La phase at lower temperatures, whereas an III
phase is formed with increasing temperature. An HII phase
is formed at the highest temperatures and at a low water
content (10 wt%). This is in accordance with former studies
(Andersson et al., 1996), where it was found that the III
phase remains for MGlcDAG at higher temperatures when
the water concentration was raised.
The results obtained for MGlcDAG of natural origin are
in agreement with studies of the phase behavior of synthetic
MGlcDAG with a homologous series of saturated acyl
chains with Cn 5 11–20 (Mannock et al., 1990; Sen et al.,
1990). It was found that di-14:0-MGlcDAG transforms
from an La phase to an III phase at 105°C, and the phase
transition temperature was reduced to 82.0°C and 79.1°C
for the di-15:0- and di-16:0-MGlcDAG species, respectively. An HII phase was formed instead of an III phase when
Cn . 16. The transition temperature was found to be 76.6°C
for di-17:0-MGlcDAG and was only slightly reduced for the
longer chains. Thus a lipid with short acyl chains is less
wedge-shaped than a lipid with long acyl chains, and because of packing restrictions short-chain lipids form aggregates with less curvature than long-chain lipids, i.e., a cubic
phase is favored by the short-chain lipids (see also Lewis et
al., 1997).
The reflections obtained by x-ray measurements on the
MGlcDAG with short acyl chains, at 20% water, showed
that the III phase belongs to the body-centered space group
Ia3d. In the study by Lindblom et al. (1986), the cubic phase
formed by DOMGlcDAG was also assigned to this space
group. Sen et al. (1990) found that the cubic phase formed
by synthetic MGlcDAG with short acyl chains belongs to
the Pn3m or Pn3 space group. The water content in the latter
MGlcDAG samples was significantly higher than in the
samples investigated in this work. These results are in line
with the experimental and theoretical observations that the
sequence of formation of different cubic phases with increasing water content is Ia3d3 Pn3m3 Im3m (Lindblom
and Rilfors, 1989). The lipid translational diffusion coefficient obtained in this study is of a magnitude (10212 m2/s)
similar to that measured for DOMGlcDAG (Lindblom et al.,
1986), and it is of a magnitude similar to that observed, for
example, for dioleoylphosphatidylcholine in a bicontinuous
cubic phase (Lindblom, 1996). It is therefore concluded that
the cubic phase of MGlcDAG investigated here is also
bicontinuous (Lindblom, 1996; Lindblom and Orädd, 1994;
Lindblom and Rilfors, 1989; Rilfors et al., 1986).
Nonlamellar tendencies in total lipid extracts
Theories for the self-assembly of lipid molecules (Gruner,
1985; Helfrich, 1973; Israelachvili, 1991) form the basis for
the model that we have presented concerning the regulation
of the membrane lipid composition in A. laidlawii A and E.
coli (Andersson et al., 1996; Morein et al., 1996; Rilfors et
�2884
Biophysical Journal
Volume 75
December 1998
TABLE 5 Observed reflections in the cubic phase of the short-chain MGlcDAG sample containing 20 wt% water, together with
the assigned hkl values according to the cubic space group Ia3d at 57°C
d (Å)
h2 1 k2 1 l2
46.5
6
40.5
8
30.4
14
28.4
16
25.6
20
23.5
24
22.6
26
18.7
38
17.7
42
16.9
46
16.1
50
14.6
62
The acyl chain composition is given in Table 1.
al., 1993). Eight different polar headgroups occur in the
membrane lipids of A. laidlawii A; four of these lipids are
able to form, or to induce the formation of, reversed nonlamellar phases; three lipids form only lamellar phases; and
one lipid can form a diluted solution phase of normal
micelles (Andersson et al., 1996; Danino et al., 1997;
Hauksson et al., 1994a,b, 1995; Lindblom et al., 1993;
Rilfors et al., 1993). The molar fractions of all of these
lipids are metabolically varied in relation to the structure of
the fatty acids that are either synthesized endogenously or
taken up by the cells from the growth medium and covalently incorporated into the lipids. From studies of A.
laidlawii A lipids containing acyl chains of medium lengths,
it has been concluded that the fractions of the eight lipids
are balanced in such a way that the TNL values for total lipid
extracts are maintained within rather narrow limits (Lindblom et al., 1986; Niemi et al., 1997; Osterberg et al., 1995;
Rilfors et al., 1994). From this conclusion we stated our
model for the balance between lamellar-forming and nonlamellar-forming lipids, predicting a regulation of the membrane lipid composition in biological membranes. Because
the acyl chain length has a large impact on the TNL values
for synthetic membrane lipids, one question we ask in the
present study is whether our model also holds for total lipid
extracts with very short and long acyl chains.
The TNL values for the total lipid extracts are presented in
Table 3 for different water contents, and it is obvious that
nonlamellar phases can be formed by total lipid extracts
with both Cn 5 15.0 and Cn 5 19.1. The TNL values for the
two lower water contents differ by 5–10°C. At 40 wt%
water the difference is somewhat larger (10 –15°C), and a
small fraction of a cubic phase is formed, in addition to the
HII phase, in the short-chain lipid extract. The shift in phase
equilibria toward an La phase with an increasing degree of
hydration is in accordance with earlier reports on various
lipid-water systems (Gulik et al., 1985, 1988; Gulik-Krzywicki et al., 1967; Luzzati and Husson, 1962; Rilfors et al.,
1984; Rivas and Luzzati, 1969; Seddon, 1990).
Can the differences in the TNL values (for example,
;10 –15°C for 40 wt% water) for the total lipid extracts
with long and short acyl chains be judged as large or small?
One way to consider this question is to compare the variations in these TNL values with the variations that would
result if the polar headgroup composition were kept constant when the acyl chain length is altered. Unfortunately,
with the available limited data on TNL values for lipids and
lipid mixtures from A. laidlawii, this question is difficult to
answer. Indeed, TNL values for saturated MGlcDAG species
with different chain lengths have been determined (Mannock et al., 1990; Sen et al., 1990), but such data are not
available for MAMGlcDAG and MADGlcDAG. Moreover,
even if TNL data from all single lipids were available, they
would not be sufficient, of course, for a prediction of TNL
values for fictitious total lipid mixtures, because these values are not weighted averages.
The second question we ask in this study is, which lipids
are responsible for the nonlamellar tendencies in total lipid
extracts with short and long acyl chains? The different lipid
classes in A. laidlawii A have been shown to be preferentially synthesized at different acyl chain compositions
(Andersson, 1998; Andersson et al., 1996). MGlcDAG and
MADGlcDAG are the major nonlamellar-forming lipids
when the organism is grown with fatty acids having Cn #
16. With short acyl chains MGlcDAG forms predominantly
La and III phases, whereas MADGlcDAG forms only an HII
phase above the chain melting temperature. Thus the triacylglucolipid MADGlcDAG is a much more potent nonlamellar-forming lipid than MGlcDAG under these conditions. Both glucolipids are responsible for the maintenance
of the nonlamellar tendencies when the organism incorporates short-chain fatty acids, but the potency of MGlcDAG
is probably too weak and it therefore has to be assisted by
MADGlcDAG to maintain the nonlamellar tendencies according to our model. The difference in nonlamellar-forming potency between the two lipids is reflected by the fact
that MGlcDAG constitutes a considerably larger fraction in
the cell membrane (Table 2). MADGlcDAG also reduces
the average area per acyl chain and thus causes a tighter
packing of the lipid molecules (Andersson et al., 1998). This
effect may be advantageous when the membrane lipids
contain short acyl chains, because the permeability across
the membrane probably increases with such chains (McElhaney, 1992a).
When A. laidlawii A is grown with medium-chain and
long-chain fatty acids, the nonlamellar tendencies in the
membrane are principally maintained by MGlcDAG, DAG,
and MAMGlcDAG. The latter two lipids are mainly synthesized when saturated acyl chains constitute more than 50
mol% (Andersson et al., 1996; Wieslander et al., 1995). It is
less straightforward to find a rationale for this combination
of nonlamellar-forming and nonlamellar-inducing lipids
than for the combination of MGlcDAG and MADGlcDAG
with short acyl chains. DAGs do not form any liquid crystalline phase (Di and Small, 1993), and the existing literature data reporting the effects of different DAGs on phosphatidylcholine and phosphatidylethanolamine bilayers
only permit speculations to be made about the roles of DAG
in A. laidlawii A. The DAGs synthesized by the organism
can be anticipated to decrease the TNL value of lipids in a
bilayer with a tendency to form reversed nonlamellar phases
�Andersson et al.
Short-Chain Lipids Form Nonlamellar Phases
(Epand, 1985; Siegel et al., 1989). MGlcDAG with long and
predominantly saturated acyl chains has rather high TNL
values (Mannock et al., 1990; Sen et al., 1990). It may
therefore be advantageous to the cells to exchange a fraction
of MGlcDAG for DAG, because DAGs can drastically
decrease the TNL values (Epand, 1985; Siegel et al., 1989).
When synthesized, MAMGlcDAG constitutes only a small
fraction in A. laidlawii A membranes (Andersson, 1998;
Andersson et al., 1996). However, it is a very potent nonlamellar-forming lipid (Lindblom et al., 1993), and it possibly contributes to keeping the balance between lamellarforming and nonlamellar-forming lipids. Neither DAG nor
MAMGlcDAG is synthesized when A. laidlawii A incorporates long, unsaturated acyl chains into the membrane lipids.
The TNL value of MGlcDAG is then decreased (Lindblom et
al., 1986), and the other two lipids are probably not required.
Finally, the question can be asked if regulation of the
polar headgroup composition in A. laidlawii A membranes
can have the aim of keeping other physicochemical parameters constant, such as the surface charge density, the gel/La
phase transition temperature (Tm), the order parameter of
the acyl chains, or the spontaneous curvature of the membrane lipids. The anionic lipid fraction in A. laidlawii A
generally increases with the degree of acyl chain unsaturation (Andersson, 1998; Andersson et al., 1996; Wieslander
et al., 1995); however, the conclusion drawn by Christiansson et al. (1985), that the surface charge density of the lipid
bilayer is kept constant, was not corroborated by a recent
study by Andersson et al. (1998). It has been observed in
several studies that A. laidlawii can tolerate large variations
in the Tm values of its membrane lipids, even when it is
grown at the same temperature, and a regulation of this
parameter can be excluded in many cases (McElhaney,
1992b, 1994; Rilfors et al., 1993). The order parameter of
the acyl chains has been determined in both strains A and B
of A. laidlawii when the cells were grown with different
fatty acids. The average order parameter in intact membranes varied over the range 0.14 – 0.19 and 0.14 – 0.18 in
strain A and B, respectively (Monck et al., 1992; Thurmond
et al., 1994). It can be noted that the highest values of the
order parameter in strain A were obtained when the membrane lipids contained short acyl chains. The nonlamellar
tendencies of a lipid bilayer can be expressed by the spontaneous radius of curvature (R0) of the monolayers (Gruner,
1985). R0 values for various total lipid extracts from A.
laidlawii A fall within a narrow range (58 –73 Å) compared
to the range represented by pure MGlcDAG and DGlcDAG
species (17–123 Å) (Osterberg et al., 1995). Thus the spontaneous radius of curvature is maintained within a narrow
interval for A. laidlawii A membrane lipids.
From the previously described arguments we conclude
that probably only two physicochemical parameters are
consistently regulated in A. laidlawii A membranes, namely
the balance between lamellar-forming and nonlamellarforming lipids, and the spontaneous radius of curvature of
the lipid monolayers. What is more, these two parameters
represent two different ways to express the phase behavior
2885
of the membrane lipids (Osterberg et al., 1995). The regulation of the lipid composition is not strict enough to maintain these parameters at a well-defined value, which is
probably to be expected, because of variations that emerge
when lipids of natural origin are studied. However, the
regulation is effective enough to keep the values within a
limited range. Our present results, obtained from lipids with
limiting acyl chain lengths, further support the conclusion
that A. laidlawii A regulates the polar headgroup composition of its lipids, so that it has the capacity to maintain the
nonlamellar tendency of its lipids irrespective of the structure of the acyl chains. The results also substantiate our
revised model for the membrane lipid regulation (Andersson et al., 1996), stating that the regulation mechanism is
more complex and sophisticated than initially proposed, and
that several nonlamellar-forming lipids are involved.
We acknowledge Marie South-Wångdahl, Scotia Lipid Teknik, Stockholm,
for performing the HPLC analyses. We are also grateful to Eva Selstam for
putting her GLC equipment at our disposal and Gösta Arvidson for making
the a-deuterated oleic acid.
This work was supported by the Swedish Natural Science Research Council and the Knut and Alice Wallenberg Foundation.
REFERENCES
Andersson, A.-S. 1998. Physico-chemical properties of lipids control their
composition in Acholeplasma laidlawii and Escherichia coli membranes. Ph.D. thesis. University of Umeå, Umeå, Sweden.
Andersson, A.-S., R. A. Demel, L. Rilfors, and G. Lindblom. 1998. Lipids
in total extracts from Acholeplasma laidlawii A pack more closely than
the individual lipids. Monolayers studied at the air-water interface.
Biochim. Biophys. Acta. 1369:94 –102.
Andersson, A.-S., L. Rilfors, M. Bergqvist, S. Persson, and G. Lindblom.
1996. New aspects on membrane lipid regulation in Acholeplasma
laidlawii A and phase equilibria of monoacyldiglucosyldiacylglycerol.
Biochemistry. 35:11119 –11130.
Arnoldsson, K. C., and P. Kaufmann. 1994. Lipid class analysis by normal
phase high performance liquid chromatography, development and optimization using multivariate methods. Chromatographia. 38:317–324.
Bras, W., G. E. Derbyshire, A. J. Ryan, G. R. Mant, A. Felton, R. A. Lewis,
C. J. Hall, and G. N. Greaves. 1993. Simultaneous time resolved SAXS
and WAXS experiments using synchroton radiation. Nucl. Instrum.
Methods. A326:587–591.
Christiansson, A., L. E. Eriksson, J. Westman, R. Demel, and Å. Wieslander. 1985. Involvement of surface potential in regulation of polar
membrane lipids in Acholeplasma laidlawii. J. Biol. Chem. 260:
3984 –3990.
Danino, D., A. Kaplun, G. Lindblom, L. Rilfors, G. Orädd, J. B. Hauksson,
and Y. Talmon. 1997. Cryo-TEM and NMR studies of a micelle-forming
phosphoglucolipid from membranes of Acholeplasma laidlawii A and B.
Chem. Phys. Lipids. 85:75– 89.
Davis, J. H., K. R. Jeffrey, M. Bloom, M. I. Valic, and T. P. Higgs. 1976.
Quadrupolar echo deuteron magnetic resonance spectroscopy in ordered
hydrocarbon chains. Chem. Phys. Lett. 44:390 –394.
Di, L., and D. M. Small. 1993. Physical behavior of the mixed chain
diacylglycerol, 1-stearoyl-2-oleoyl-sn-glycerol: difficulties in chain
packing produced marked polymorphism. J. Lipid Res. 34:1611–1623.
Epand, R. M. 1985. Diacylglycerols, lysolecithin or hydrocarbons markedly alter the bilayer to hexagonal phase transition temperature of
phosphatidylethanolamines. Biochemistry. 24:7092–7095.
Gruner, S. M. 1985. Intrinsic curvature hypothesis for biomembrane lipid
composition: a role for nonbilayer lipids. Proc. Natl. Acad. Sci. USA.
82:3665–3669.
�2886
Biophysical Journal
Gulik, A., V. Luzzati, M. De Rosa, and A. Gambacorta. 1985. Structure
and polymorphism of bipolar isopranyl ether lipids from Archaebacteria.
J. Mol. Biol. 182:131–149.
Gulik, A., V. Luzzati, M. De Rosa, and A. Gambacorta. 1988. Tetraether
lipid components from a thermoacidophilic Archaebacterium. J. Mol.
Biol. 201:429 – 435.
Gulik-Krzywicki, T., E. Rivas, and V. Luzzati. 1967. Structure et polymorphisme des lipides: étude par diffraction des rayons X du système
formé de lipides de mitochondries de coeur de boeuf et d’eau. J. Mol.
Biol. 27:303–322.
Hauksson, J. B., G. Lindblom, and L. Rilfors. 1994a. Structures of glucolipids from the membrane of Acholeplasma laidlawii strain A-EF22. I.
Glycerophosphoryldiglucosyldiacylglycerol and monoacylbisglycerophosphoryldiglucosyldiacylglycerol. Biochim. Biophys. Acta. 1214:
124 –130.
Hauksson, J. B., G. Lindblom, and L. Rilfors. 1994b. Structures of glucolipids from the membrane of Acholeplasma laidlawii strain A-EF22.
II. Monoacylmonoglucosyldiacylglycerol. Biochim. Biophys. Acta.
1215:341–345.
Hauksson, J. B., L. Rilfors, G. Lindblom, and G. Arvidson. 1995. Structures of glucolipids from the membrane of Acholeplasma laidlawii strain
A-EF22. III. Monoglucosyldiacylglycerol, diglucosyldiacylglycerol, and
monoacyldiglucosyldiacylglycerol. Biochim. Biophys. Acta. 1258:1–9.
Helfrich, W. 1973. Elastic properties of lipid bilayers: theory and possible
experiments. Z. Naturforsch. 28:693–703.
Israelachvili, J. N. 1991. Intermolecular and Surface Forces. Academic
Press, London.
Koynova, R., and M. Caffrey. 1994. Phases and phase transitions of the
hydrated phosphatidylethanolamines. Chem. Phys. Lipids. 69:1–34.
Lewis, R. N. A. H., D. A. Mannock, and R. N. McElhaney. 1997. Membrane lipid molecular structure and polymorphism. In Lipid Polymorphism and Membrane Properties. R. M. Epand, editor. Academic Press,
San Diego. 25–102.
Lindblom, G. 1996. Nuclear magnetic resonance spectroscopy and lipid
phase behaviour and lipid diffusion. In Advances in Lipid Methodology.
W. W. Christie, editor. The Oily Press, Dundee, Scotland. 133–209.
Lindblom, G., I. Brentel, M. Sjölund, G. Wikander, and Å. Wieslander.
1986. Phase equilibria of membrane lipids from Acholeplasma laidlawii:
importance of a single lipid forming nonlamellar phases. Biochemistry.
25:7502–7510.
Lindblom, G., J. B. Hauksson, L. Rilfors, B. Bergenståhl, Å. Wieslander,
and P.-O. Eriksson. 1993. Membrane lipid regulation in Acholeplasma
laidlawii grown with saturated fatty acids. Biosynthesis of a triacylglucolipid forming reversed micelles. J. Biol. Chem. 268:16198 –16207.
Lindblom, G., and G. Orädd. 1994. NMR studies of translational diffusion
in lyotropic liquid crystals and lipid membranes. Prog. NMR Spectrosc.
26:483–516.
Lindblom, G., and L. Rilfors. 1989. Cubic phases and isotropic structures
formed by membrane lipids—possible biological relevance. Biochim.
Biophys. Acta. 988:221–256.
Luzzati, V., and F. Husson. 1962. The structure of the liquid-crystalline
phases of lipid-water systems. J. Cell Biol. 12:207–219.
Mannock, D. A., R. N. A. H. Lewis, and R. N. McElhaney. 1990. Physical
properties of glycosyl diacylglycerols. 1. Calorimetric studies of a homologous series of 1,2-di-O-acyl-3-O-( a - D -glucopyranosyl)-snglycerols. Biochemistry. 29:7790 –7799.
Mannock, D. A., and R. N. McElhaney. 1991. Differential scanning calorimetry and x-ray diffraction studies of a series of synthetic b-Dgalactosyl diacylglycerols. Biochem. Cell Biol. 69:863– 867.
McElhaney, R. N. 1992a. Membrane function. In Mycoplasmas: Molecular
Biology and Pathogenesis. J. Maniloff, R. N. McElhaney, L. R. Finch,
and J. B. Baseman, editors. American Society for Microbiology, Washington, DC. 259 –287.
McElhaney, R. N. 1992b. Membrane structure. In Mycoplasmas: Molecular Biology and Pathogenesis. J. Maniloff, R. N. McElhaney, L. R.
Finch, and J. B. Baseman, editors. American Society for Microbiology,
Washington, DC. 113–155.
McElhaney, R. N. 1994. Techniques for measuring lipid phase state and
fluidity in biological membranes. In Temperature Adaptation of Biological Membranes. A. R. Cossins, editor. Portland Press, London. 31– 48.
Volume 75
December 1998
Monck, M. A., M. Bloom, M. Lafleur, R. N. A. H. Lewis, R. N. McElhaney, and P. R. Cullis. 1992. Influence of lipid composition on the
orientational order in Acholeplasma laidlawii strain B membranes: a
deuterium NMR study. Biochemistry. 31:10037–10043.
Morein, S., A.-S. Andersson, L. Rilfors, and G. Lindblom. 1996. Wild-type
Escherichia coli cells regulate the membrane lipid composition in a
“window” between gel and non-lamellar structures. J. Biol. Chem.
271:6801– 6809.
Niemi, A. E., A.-S. Andersson, L. Rilfors, G. Lindblom, and G. Arvidson.
1997. The effect of hydration and divalent cations on lamellarnonlamellar phase transitions in membranes and total lipid extracts from
Acholeplasma laidlawii A-EF22—a 2H-NMR study. Eur. Biophys. J.
26:485– 493.
Niemi, A. R., L. Rilfors, and G. Lindblom. 1995. Influence of monoglucosyldiacylglycerol and monoacylmonoglucosyldiacylglycerol on the
lipid bilayer of the membrane from Acholeplasma laidlawii strain AEF22. Biochim. Biophys. Acta. 1239:186 –194.
Osterberg, F., L. Rilfors, Å. Wieslander, G. Lindblom, and S. M. Gruner.
1995. Lipid extracts from membranes of Acholeplasma laidlawii A
grown with different fatty acids have a nearly constant spontaneous
curvature. Biochim. Biophys. Acta. 1257:18 –24.
Rietveld, A. G., J. A. Killian, W. Dowhan, and B. de Kruijff. 1993.
Polymorphic regulation of membrane phospholipid composition in
Escherichia coli. J. Biol. Chem. 268:12427–12433.
Rilfors, L., P.-O. Eriksson, G. Arvidson, and G. Lindblom. 1986. Relationship between three-dimensional arrays of “lipidic particles” and
bicontinuous cubic lipid phases. Biochemistry. 25:7702–7711.
Rilfors, L., J. B. Hauksson, and G. Lindblom. 1994. Regulation and phase
equilibria of membrane lipids from Bacillus megaterium and Acholeplasma laidlawii strain A containing methyl-branched acyl chains. Biochemistry. 33:6110 – 6120.
Rilfors, L., G. Lindblom, Å. Wieslander, and A. Christiansson. 1984. Lipid
bilayer stability in biological membranes. In Biomembranes, Vol. 12. M.
Kates and L. A. Manson, editors. Plenum Press, New York. 205–245.
Rilfors, L., Å. Wieslander, and G. Lindblom. 1993. Regulation and physicochemical properties of the polar lipids in Acholeplasma laidlawii. In
Subcellular Biochemistry, Vol. 20: Mycoplasma Cell Membranes. S.
Rottem and I. Kahane, editors. Plenum Press, New York. 109 –166.
Rilfors, L., Å. Wieslander, and S. Ståhl. 1978. Lipid and protein composition of membranes of Bacillus megaterium variants in the temperature
range 5 to 70°C. J. Bacteriol. 135:1043–1052.
Rivas, E., and V. Luzzati. 1969. Polymorphisme des lipides polaires et des
galacto-lipides de chloroplastes de mais, en présence d’eau. J. Mol. Biol.
41:261–275.
Seddon, J. M. 1990. Structure of the inverted hexagonal (HII) phase, and
non-lamellar phase transitions of lipids. Biochim. Biophys. Acta. 1031:
1– 69.
Seddon, J. M., G. Cevc, R. D. Kaye, and D. Marsh. 1984. X-ray diffraction
study of the polymorphism of hydrated diacyl- and dialkylphosphatidylethanolamines. Biochemistry. 23:2634 –2644.
Sen, A., S. W. Hui, D. A. Mannock, R. N. A. H. Lewis, and R. N.
McElhaney. 1990. Physical properties of glycosyl diacylglycerols. 2.
X-ray diffraction studies of a homologous series of 1,2-di-O-acyl-3-O(a-D-glucopyranosyl)-sn-glycerols. Biochemistry. 29:7799 –7804.
Sen, A., W. P. Williams, and P. J. Quinn. 1981. The structure and
thermotropic properties of pure 1,2-diacylgalactosylglycerol in aqueous
systems. Biochim. Biophys. Acta. 666:380 –389.
Shipley, G. G., J. P. Green, and B. W. Nichols. 1973. The phase behavior
of monogalactosyl, digalactosyl, and sulphoquinovosyldiglycerides.
Biochim. Biophys. Acta. 311:531–544.
Siegel, D. P., J. Banschbach, D. Alford, H. Ellens, L. J. Lis, P. J. Quinn,
P. L. Yeagle, and J. Bentz. 1989. Physiological levels of diacylglycerols
in phospholipid membranes induce membrane fusion and stabilize inverted phases. Biochemistry. 28:3703–3709.
Smaal, E. B., D. Romijn, W. S. M. Geurts van Kessel, B. De Kruijff, and
J. De Gier. 1985. Isolation and purification of cardiolipin from beef
heart. J. Lipid Res. 26:634 – 637.
Stejksal, E. O., and J. E. Tanner. 1965. Spin diffusion measurements: spin
echoes in the presence of a time-dependent field gradient. J. Chem. Phys.
42:288 –292.
�Andersson et al.
Short-Chain Lipids Form Nonlamellar Phases
Stilbs, P. 1987. Fourier transform pulsed-gradient spin-echo studies of
molecular diffusion. Prog. NMR Spectrosc. 19:1– 45.
Thurmond, R. L., A. R. Niemi, G. Lindblom, Å. Wieslander, and L.
Rilfors. 1994. Membrane thickness and molecular ordering in Acholeplasma laidlawii strain A studied by 2H NMR spectroscopy. Biochemistry. 33:13178 –13188.
Tulloch, A. P. 1977. Preparation of specifically dideuterated octadecanoates and oxooctadecanoates. Lipids. 12:92–98.
2887
Wieslander, Å., A. Christiansson, L. Rilfors, and G. Lindblom. 1980. Lipid
bilayer stability in membranes. Regulation of lipid composition in Acholeplasma laidlawii as governed by molecular shape. Biochemistry. 19:
3650 –3655.
Wieslander, Å., S. Nordström, A. Dahlqvist, L. Rilfors, and G. Lindblom.
1995. Membrane lipid composition and cell size of Acholeplasma laidlawii strain A are strongly influenced by lipid acyl chain length. Eur.
J. Biochem. 227:734 –744.
�