Proc. Nati. Acad, Sci. USA
Vol. 87, pp. 8306-8310, November 1990
Biochemistry
Evidence for involvement of multiple forms of cytochrome P-450 in
aflatoxin B1 metabolism in human liver
LESLEY M. FORRESTER*, GORDON E. NEALt, DAVID J. JUDAHt, MICHAEL J. GLANCEY*,
AND C. ROLAND WOLF*t
*Imperial Cancer Research Fund, Molecular Pharmacology Group, University Department of Biochemistry, Hugh Robson Building, George Square,
Edinburgh EH8 9XD, United Kingdom; and tMedical Research Council Toxicology Unit, Medical Research Council Laboratories,
Woodmansterne Road, Carshalton, Surrey SM5 4EF, United Kingdom
Communicated by Roy Hertz, June 12, 1990
and to understand the genetic and environmental factors
which determine their level of expression.
In animal model systems, evidence for the involvement of
a wide variety of P450 isozymes, from several gene families,
in the metabolism of AFB1 has been forthcoming. These
include proteins from the 3-methylcholanthrene-inducible
family P4501A (5-7), the phenobarbital-inducible P450IlB
subfamily (8, 9), and P450IIC subfamily (10), the dexamethaxone-inducible P450IIIA family (11), and possibly
P450s from the family P450IVB (8).
The complexity of the rodent system does not permit easy
identification of candidate human P450s involved in the
activation and metabolism of this compound. Induction of
specific AFB1 metabolic pathways in rodents, however, has
indicated the catalytic roles played by the induced P450
species. The administration of polycyclic hydrocarbons induces predominantly 4-hydroxylation, forming aflatoxin Ml
(AFM1), and to a much lesser extent epoxidation, whereas
phenobarbital induces epoxidation and aflatoxin Q, (AFQ1)
formation to approximately equal extents (12). In the case of
human microsomes, Shimada and Okuda (11) concluded that
constitutively expressed forms were probably involved in
AFB1 activation. They excluded cytochromes from the
P450IA and P45OIIB gene families, as antibodies raised
against the rat homologues of these proteins did not inhibit
AFB1 metabolism in human liver. Studies using immunochemical inhibition indicated that the P450 associated with
the polymorphic metabolism of debrisoquine, subfamily
P450IID, was also not involved in the metabolism of AFB1
either to a DNA-binding species or to AFQ1 (13). Shimada
and Guengerich (14) have recently reported that the major
cytochrome P450 associated with AFB1 activation is a member of the P450IIIA family, a protein also associated with the
oxidation of nifedipine. Their evidence was based principally
on correlations between level of the P450IIIA cytochrome
and the rate of AFB1 metabolism to mutagenic products or
products that bound to DNA. However, their experiments
using reconstituted cytochrome systems indicated that the
activation of AFB1 to mutagenic species was not confined to
P450IIIA, although this enzyme had the highest activity of
the three tested. These workers selected a single liver sample
for further study, and found a surprisingly high activity
towards sterigmatocystin (>2 x the activity towards AFB1)
and a very low activity towards aflatoxin G1 (AFG1). This is
unexpected in view of the potent carcinogenic and toxic
properties of AFG1 and the low carcinogenicity of sterigmatocystin noted in animal experiments. Since the liver sample
used also had an unusually high P450 level, the question is
raised as to how typical this sample is of the range of human
microsomes. In view of the broad range of P450s with the
Liver cancer is a major cause of premature
ABSTRACT
death in many areas of Africa and Asia and its incidence is
strongly correlated with exposure to aflatoxin B1 (AFB1).
Because AFB1 requires metabolic activation to achieve a biological response, there is a need for detailed knowledge of the
mechanism of activation to assess individual risk. We have
carried out an extensive study using a total of 19 human liver
samples to determine the individual variability in the metabolism of the toxin to mutagenic or detoxification products and
to identify the specific cytochrome P450 forms involved in
these processes. Metabolism to the toxic 8,9-epoxide or to
products mutagenic in the Ames test was found to exhibit very
large individual variation. The rates of metabolic activation
were highly correlated with both the level of proteins of the
P450I1A gene family and with the total cytochrome P450
content of the microsomes. In agreement with this, antibodies
reacting with P450IHA proteins were strong inhibitors of both
the metabolism and mutagenicity in the majority of the samples. However, the inhibition varied between 50% and 100%.
The expression of a protein in the P45011C gene family also
correlated with AFBI metabolism and mutagenicity. This result
therefore indicated the involvement of cytochromes other than
P450I1A in the activation of AFBI by human liver microsomes.
This hypothesis was strongly supported by the finding that
antibodies to P4501A2 and P45011A1 were also effective inhibitors of metabolism in many of the samples. These data
demonstrate that, although P450I1A probably plays an innportant role in AFBI activation, several other cytochrome
P-450 forms have the capacity to activate the toxin. Similar
considerations apply to detoxifying metabolism to aflatoxin Qi
and aflatoxin M1. The levels of expression of many of the forms
of cytochrome P450 involved in AFBI metabolism are known
to be highly sensitive to environmental factors. This indicates
that such factors will be an important determinant in individual
susceptibility to the tumorigenic action of AFBI.
Liver cancer is one of the major causes of premature death
in certain regions of Africa and Asia. Two major environmental factors have been implicated in the etiology of this
disease: infection with hepatitis B virus and exposure to the
chemical carcinogen aflatoxin B1 (AFB1) (1, 2). AFB1 is a
mycotoxin produced by species of Aspergillus, and human
exposure results principally from the ingestion of stored
foodstuffs contaminated with the mold. The carcinogenicity
of this compound is associated with its conversion to aflatoxin 8,9-oxide by the hepatic cytochrome P-450 (P450)dependent monooxygenase system (3, 4). It is therefore of
considerable importance to establish which human P450
isozymes are involved in the metabolism of this compound
Abbreviations: AFB1, aflatoxin B1; AFQ1, aflatoxin Qi; AFM1,
aflatoxin M1; P450, cytochrome P450. The nomenclatures for the
P450 isozymes and gene families are described by Nebert et al. (19).
tTo whom reprint requests should be addressed.
The publication costs of this article were defrayed in part by page charge
payment. This article must therefore be hereby marked "advertisement"
in accordance with 18 U.S.C. §1734 solely to indicate this fact.
8306
�'*:,-^2atHrme
a E | A. . '
-
_
| | _ I' _
-';
k,.'. ||_
Ax
!Xr He's
i:, ': .::'
_
*:
4
.,:
-
IA IIA IIC [ID
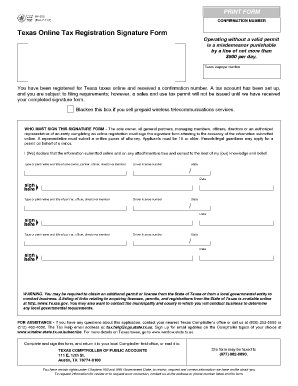
FIG. 1. Proteins identified in human liver by using antibodies
raised to rat liver P450 proteins. Microsomal proteins from a single
human liver (7.5 ug per track) were loaded across a 7% polyacrylamide slab gel and separated by electrophoresis. The proteins were
transferred to nitrocellulose and the filter was inserted into an
apparatus that allows simultaneous exposure to several P450 antibodies without cutting the nitrocellulose sheet (Decca probe;
Hoefer). The antibodies used were raised to the following rat liver
P450s: P4501A2, P45011A1, P45011B1, P45011C6, P4501ID6 (human
monoclonal antibody), P45011E1, P450111A1, and P450IVA1 (see ref.
19 for the nomenclatures used). The estimated molecular masses are
given in Table 2. Samples P45011B and P450IVA were run on a
separate gel. The antibodies used reacted specifically with recombinant human P450s from the gene families to which the antibodies
were raised and, on the basis of relative mobility in SDS gels, the
P450s were categorized according to the nomenclature of Nebert et
al. (19) as: P450IIAii = P45011A3, P45011B = P45011B6, P450IICi =
P45011C9, P450IICii = P45011C8, and P450111A = P450111A3 or
P450111A4. These latter two recombinant proteins reacted with the
antibody to P450IIIA1 and have the same mobility on SDS gels.
Proc. Natl. Acad. Sci. USA 87 (1990)
8307
protein bands were identified. This is consistent with the
reports of the expression of multiple members of this gene
family in human liver (20) and the isolation of cDNA clones
encoding several distinct proteins (21). Where possible, antibody specificity was demonstrated by showing specific
reactivity with the expressed recombinant P450 proteins (a
generous gift of Dr. F. Gonzalez). The recombinant proteins
also had the same electrophoretic mobilities as the proteins
identified in the microsomes by Western blot analysis (see
legend to Fig. 1).
Immunoblotting. Microsomal samples (7.5 Ag) were separated by SDS 9% polyacrylamide gel electrophoresis, transferred to nitrocellulose, and exposed to the P450 antibodies
(1:500 dilution) as previously described (22, 23). Following
exposure to 125I-labeled staphylococcal protein A (0.19 MBq)
bands were visualized by autoradiography and relative concentrations of P450 isozymes in the different samples were
determined by laser scanning of the autoradiographs. Relative P450 content was established by preparing standard
curves from the microsomal samples loaded in a series of
concentrations.
HPLC Analysis of AFBI Metabolites. Human microsomal
protein (0.05-0.4 mg) was incubated with AFB1 (5 tkM) and
a NADPH-generating system in 0.1 M Tris HCI, pH 7.4, for
15 min at 370C (24). In this incubation system AFB1 8,9dihydrodiol reacts with Tris buffer to form a highly fluorescent, stable, Schiff base. Metabolites were extracted and
analyzed by HPLC as previously described (25).
Mutagenicity Testing. The metabolic activation of AFB1 to
mutagenic proteins was assessed by using the standard
bilayer plate incorporation test developed by Ames et al. (26).
Microsomal protein (0.1 mg) was added to a cofactor mixture
containing 8 mM MgCI2, 33 mM KCl, 5 mM glucose 6-phosphate, and 4 mM NADP+ in 50 mM sodium phosphate buffer,
pH 7.4. The mixture was poured onto prepoured agar plates
(Difco) immediately after the addition-of 5 ,uM AFB1, 0.1 ml
of an overnight culture of Salmonella typhimurium strain
TA98, and 2 ml of 0.6% agar containing 0.6% NaCl, 50 JIM
L-histidine hydrochloride, 50 ,uM biotin, and ampicillin at 250
,ug/ml. Plates, in triplicate, were incubated for 48 hr at 37°C.
The bacterial strain was routinely tested for ampicillin resistance, histidine requirement, and deep rough character (tested by using crystal violet) and with reference mutagens in
discs impregnated with 10 ,ul of sodium azide at 100 ,ug/ml,
4-nitro-o-phenylenediamine at 600 ug/ml, or nitrofurantoin
at 10 ,g/ml as described by Zeiger et al. (27). Mutation
frequency was determined from the number of histidineindependent revertant colonies.
RESULTS
P450 isozyme levels in a range of human liver samples,
determined by Western blotting, were compared with the
ability of the samples to metabolize AFB1 to products mutagenic to S. typhimurium, to the carcinogenic AFB1 8,9epoxide (assayed as AFB1 8,9-dihydrodiol), and to the detoxification products AFQ1 and AFM1. Both AFQ1 and AFBj
8,9-dihydrodiol were produced in significant amounts by the
human liver samples and represented up to 80% of the total
soluble metabolites formed with lower amounts of AFM1
(Table 1). Of the P450 forms detected by Western blot
analysis (Fig. 1) there was a high correlation between AFBj
metabolism to the carcinogenic AFB1 8,9-epoxide (assayed
as AFB1 8,9-dihydrodiol) and the microsomal content of
P450IIIA3/P450IIIA4 (Table 2). Interestingly, the formation
of AFQ1, an AFB1 detoxification product, also correlated
strongly with the expression of these proteins (Table 2). It is
perhaps significant that the formation of these products was
also highly correlated with the total P450 content. The
expression of P450IIIA3/P450IIIA4, as well as total P450
�8308
Biochemistry: Forrester et al.
Table 1. Metabolism of AFB1 by human liver microsomes
Rate of AFB1
metabolism,
,ug product
Total
Unchanged
per incubation
Microsomal
metabolism,
AFB1,
sample
Diol AFQ1 AFM1
ng/min
Ag
L4
0.45 2.80
0.02
296.0
0.64
L5
0.12 1.37
0.05
137.2
3.02
L7
0.22 2.48
0.04
287.7
0.76
L8
0.28 2.78
0.04
312.8
0.39
L9
0.17 1.93
0.02
192.6
2.19
L10
0.13 1.68
0.02
165.4
2.60
L11
0.12 1.40
0.02
123.9
3.22
L12
0.24 2.86
0.09
279.1
0.89
LW1
0.09 0.98
95.5
0.02
3.65
LB1
0.22 2.56
0.06
280.1
0.88
Incubations at 370C were carried out for 15 min in mixtures
containing 400,ug of microsomal protein. Other details are described
in refs. 25 and 26. Total AFB1 recovery was 68-99%.
content, was also highly correlated with AFB1-induced mutation rate (Fig. 2, Table 2). In the 19 liver samples studied,
the level of P450IIIA protein was subject to a 26-fold variation, compared with a 13-fold variation in mutation frequency
and a 5-fold variation in the rate of AFB1 8,9-dihydrodiol
formation.
For the liver panel shown in Table 2 AFB1-induced mutagenicity and metabolism to the AFB1 8,9-dihydrodiol and
AFQ1 also correlated with the level of a protein in the
P450IIC gene subfamily (band P450IICii, P4501IC8). In further studies, using a second panel of human liver microsomes, the high correlation with P450IIIA3/P450IIIA4, as
well as P450 content, was confirmed. A correlation with a
member of the P450IVA family (band P450IVAiii, P < 0.05)
was also observed (results not shown). In this panel the
association of metabolic activation with the level of P450IIC8
protein did not reach statistical significance. In these latter
studies the metabolism of AFB1 to AFM1 also correlated with
the expression of what appears to be P450IA2 (P < 0.05) (data
not shown).
The above data indicated that several human P450 forms
have the capacity to metabolize and activate AFB1. The
Table 2. Correlations between P450 isozyme expression and
AFB1 metabolism and mutagenicity
Spearman rank coefficient
AFB1
AFB1
P450 band
kDa mutagenicity 8,9-diol
AFQ1
53.0
0.00
0.00
0.14
P450IA (IA2)
54.5
0.10
-0.16
-0.08
P450IIAi
51.5
0.48
0.30
0.29
P450IIAii (IIA3)
51.0
0.19
0.47
0.47
P450IIBi (IIB6)
54.5
0.57
0.32
P450IICi (IIC9)
0.24
P45OIICii (IIC8)
52.5
0.74*
0.62*
0.65*
51.0
0.42
0.49
0.39
P450IICiii
51.5
-0.36
-0.18
-0.06
P450IID (IID6)
54.5
-0.36
-0.28
-0.41
P450IIE (IIE1)
0.96**
0.86** 0.88**
P450IIIA (IIIA3/A4) 52.5
ND
0.036
-0.09
0.21
P450IVAii
ND
0.36
0.41
0.32
P450IVAiii
0.87**
Total P450
0.86** 0.83**
P450 reductase
0.50
0.38
0.45
AFB1 metabolism was assayed either by an S. typhimurium
mutagenicity test or by HPLC for the AFB1 8,9-diol and AFQ1.
Probable nomenclature according to Nebert et al. (19) is given in
parentheses. ND, not determined.
*P < 0.05.
**P < 0.005.
Proc. Natl. Acad. Sci. USA 87 (1990)
7"M
X,
T
500
0
250
71 r-l r2;
0
r--l
r--l
L4 5 7 8 9 10 11 12 13 14 15 16 BI W1
FIG. 2. Comparison of the metabolic activation of AFB1 with the
expression of P450IIIA-related proteins in human liver. (Upper)
Western blot analysis on a panel of human liver microsomal samples.
The leftmost band is a rat liver P450IIIA1 standard. (Lower) Ability
of these microsomal samples to convert AFB1 to mutagenic products, measured by the number of S. typhimurium histidineindependent revertants in the Ames test. Revertants are expressed
per 0.1 mg of microsomal protein per assay after subtraction of
background values. The values shown are mean ± SD for triplicate
determinations.
strong correlation with P450IIIA proteins is because they
represent the major P450 form(s) in human liver. To assess
the relative role of different P450s in AFB1 metabolism the
ability of antibodies to inhibit AFB1 activation was determined. The antibodies used have been shown to be effective
inhibitors of other P450-mediated monooxygenase reactions
in human liver (refs. 28 and 29; unpublished data).
The antibody to P450IIIA1 was found to be a potent
inhibitor of AFB1-induced mutagenesis in all of the liver
samples tested, irrespective of the capacity of the individual
microsome samples to metabolize the compound to mutagenic products (Figs. 2 and 3). In all four of the liver samples
that were used to give the results detailed in Fig. 3, more than
80o inhibition of mutagenicity was observed at the highest
concentration of IgG used. In two separate experiments using
human liver microsomal preparations, anti-P450IIIA1 was
found to be an inhibitor of AFB1 metabolism to AFB1
8,9-dihydrodiol (Figs. 4 and 5). The level of inhibition,
however, varied significantly between samples and ranged
120.LiverL4
IOU
a
75
60-
*
0-~-
Liver L5
am
.2150.!4
E
2
Pi
00\1I
INA
so
s
UA
INA
00
5
10
15
0
5
10
15
lgG (mg/mg protein)
FIG. 3. Inhibition of AFB1-induced mutagenicity by P450 antibodies. The amount of microsomal protein for each assay plate was
0.25 mg for livers L5 and L10 and 0.1 mg for L4 and B1. Different
amounts were used to optimize the number of revertants obtained.
Control mutation frequencies were obtained in the presence of an
equivalent concentration of preimmune serum (PI). The antibodies
used were to the rat P450s P450IA2 (IA), P45011A1 (hIA), and
P450IIIA1 (I1lA). Assays were carried out in triplicate and results are
expressed + SD.
�Biochemistry: Forrester et al.
Proc. Natl. Acad. Sci. USA 87 (1990)
Ant-PW450 IA
0
I*
IgG (mg/mg protein)
FIG. 4.
Effect of P450 antibodies on AFB1 metabolism to AFB1
8,9-dihydrodiol. Antibodies used were to P450IA2 (Upper) and
P450IIIA1 (Lower). Values are expressed as percentage of control
values obtained in the presence of preimmune serum. Experimental
points are the means of duplicate determinations. Liver samples used
were liver L4 (i), liver L5 (A), and liver L12 (0). AFB1 dihydrodiol
production of control uninhibited liver samples was 6.02 ng by L4,
1.13 ng by L5, and 3.62 ng by L12. Incubation mixtures contained 50
,ug of microsomal protein.
between 50o and 100%. In addition, inhibition was also
observed in many of these samples with an antibody to
P4501A2 and ranged between 0% and 62%. This antibody also
inhibited AFB,-induced mutagenicity in liver L5 by 54% (Fig.
3). The slight differences in the ability of P450IA2 or
P450IIIA1 antibodies to inhibit 7,8-diol formation vs. AFB1
mutagenicity (Fig. 4 vs. Fig. 5) may be related to the different
metabolic endpoints measured. Of the other antibodies
tested, to P450IIA1, P450IIB1, P450IIC6, and P450IVA1,
only the antibody to P450IIA1 inhibited AFB1 8,9-dihy100 LiverL7
Liver L8
50
X
0
2!
100.
E
E
Liver
Liver
11
LII
C
10
C00
100.
E
Ll,1
50
Liver 14
Liver 81
IIA
IA
lilA
IA
IIA
lIlA
Antibody
FIG. 5.
Inhibition of AFB1 metabolism to AFB1 8,9-dihydrodiol
in human livers. The antibodies to rat P4501A2 (IA), P45011A1 (IIA),
and P450111A1
(IivA) were used at 10mg of IgG per mg of microsomal
protein. The results shown are means of duplicate determinations
and
are
expressed
as
percentages
and
P450IVA1
were also
any of the samples.
of the
rates
obtained
in the
Antibodies
to
P45011C6,
P4501yB1,
ot inhibit more than 20% in
tested but
presence of preimmune serum.
8309
drodiol formation in some samples (Fig. 5). Significant variability in the effectiveness ofthis antibody was observed. The
inhibition ranged between 13% and 47%. These data support
the involvement of multiple forms of P450 in AFB1 metabolism in human liver. There did not appear to be a direct
relationship between the level of P450IA2 or P450IIA3 proteins and the ability of antibodies to these cytochromes to
inhibit AFB1 metabolism. Also, it might have been expected
that inhibition by P450IA2 or P450IIA1 antibodies would be
observed in samples containing low levels of P450IIIA protein. However, this was not the case. It is worthy of note that
the summed antibody inhibition of metabolism or mutagenesis, resulting from the use of all the antibodies in a single
liver microsomal preparation, in some cases exceeded 100%6.
The reason for this is unclear. However, similar observations
have been made in other P450 antibody inhibition and immunoquantitation studies.
DISCUSSION
We provide evidence that proteins from several distinct
human P450 gene families have the capacity to metabolize
AFB1 to both mutagenic products and the carcinogenic
8,9-epoxide. The most consistent and potent inhibitor of
AFB1 metabolism and mutagenicity was an antibody to a
member of the P450IIIA gene family. This antibody recognizes three distinct recombinant human P450IIIA proteins.
Two, which are highly homologous at the amino acid level
(P450IIIA3 and P450111A4), have the same mobility as the
protein identified in human liver by Western blot analysis
(L.M.F., F. J. Gonzalez, and C.R.W., unpublished data).
The involvement of proteins encoded by the P450IIIA gene
family in AFB1 activation is in agreement with the findings of
Shimada and Guengerich (14). The P450 identified by these
workers (P450IIIA4) catalyzes the oxidation of the calcium
channel-blocking drug nifedipine. The finding that the metabolic activation of AFB1 is also highly correlated with the
total P450 content indicates that P450IIIA proteins are often
the major P450 forms in human liver. Indeed, analysis of our
data shows that in the two liver panels used in this study the
expression of P450IIIA was significantly correlated with total
P450 content, with correlation coefficients (RJ) of 0.92 (P <
0.005) and 0.56 (P < 0.05). This indicates that the correlation
between P450IIIA3/P450IIIA4 expression and AFB1 metabolism is because it is present in high concentration and not
because it is the only P450 with the capacity to metabolize
this substrate. The potential of other P450s to metabolize
AFB1 is substantiated by the inability of P450IIIA1 antibody
to completely inhibit metabolism in many of the liver samples
and by the finding that antibodies to P450IIA1 and particularly P4501A2 were effective inhibitors of 8,9-diol formation.
Current evidence indicates that the toxic or carcinogenic
effects of AFB1 are intimately linked to both the rate of
activation and the rate of detoxification at both the primary
and secondary levels of metabolism (30). Primary detoxification by metabolism conversion to AFQ1 appears also to be
catalyzed predominantly by proteins of the P450IIIA gene
family. Whether P450IIIA3, P450IIIA4, or both proteins are
involved in both the metabolic activation and the formation
of the AFQ1 remains to be determined. It is worthy of note
that these two pathways of AFB1 metabolism are coinduced
in the rat by treatment with phenobarbital (12). It is also
interesting that the formation of AFB1, a further detoxification product, was correlated with the expression of P450IA2.
Our studies strongly support the conclusion that although
P450s in the P450IIIA gene family play an important role in
the activation of AFB1 other species of cytochrome can play
a major role. The variability in the relative role of different
enzymes is probably due to the large variation in their level
of expression. Studies in animals and humans indicate that
�8310
Biochemistry: Forrester et al.
the level of proteins encoded by the P4501A gene family is
regulated by cigarette smoke components such as polycyclic
aromatic hydrocarbons and plant alkaloids such as safrole
(31). Hepatic levels of members of the P450IIIA gene family
are regulated by glucocorticoids and a wide variety offoreign
compounds (32). Recent studies have also indicated that in
the mouse P450IIA proteins are highly inducible by pyrazole
and to a lesser degree by phenobarbital (33). It is interesting
that P450IIA proteins catalyze coumarin hydroxylation (34,
35) and that AFB1 also contains the coumarin structure. The
apparent inducibility of many of the P450s involved in AFB1
metabolism suggests that the relative importance of specific
forms in its activation will be determined by environmental
and/or hormonal factors. Whether genetic factors are also
involved remains to be established.
A genetic polymorphism in the P450IID6 in humans, which
results in a loss of the function of this protein, has been
associated with reduced susceptibility to liver cancer (36).
This indicates that this P450 is involved in the activation of
liver carcinogens. However, no correlation between AFB1
activation or AFQ1 metabolism and the level of P450IID6
protein was found (Table 2). Indeed, in individual livers not
expressing this enzyme metabolism was often high-e.g.,
liver L7 (Table 1). Wolff et al. (13) have also shown that in rats
antibodies to P450IlD proteins do not inhibit AFB1 activation
or detoxification. The lack of correlation between the genetic
and biochemical data is difficult to reconcile unless other
factors are involved in the disease association observed.
Evidence for the involvement of AFB1 in the pathogenesis
of liver cancer in humans is strong but circumstantial. Identification of the cytochrome P450s involved in the pathways
of AFB1 metabolism may help elucidate factors that contribute to susceptibility to this disease.
We are very grateful to Dr. D. J. Back and Dr. K. Parke for
providing some of the human liver samples, Dr. F. Gonzalez for
letting us have extracts containing recombinant human P450s, Dr.
Urs Meyer for the antibody to P4501ID6, and Dr. C. S. Yang for the
antibody to P450IIE1. The authors also thank M. Craggs, J. Nicholass, and A. Ward for excellent secretarial assistance and S. Bruce
for his photographic work.
1. Harris, C. C. & Sun, T. (1984) Carcinogenesis 5, 697-701.
2. International Agency for Research on Cancer (1976) Evaluation
of Carcinogenic Risk of Chemicals to Man, I.A.R.C. Monogr.
Ser. (Int. Agency for Research on Cancer, Lyon, France), Vol.
10.
3. Swenson, D. H., Miller, J. A. & Miller, E. C. (1975) Cancer
Res. 35, 3811-3823.
4. Swenson, D. H., Lin, J. K., Miller, E. C. & Miller, J. A. (1977)
Cancer Res. 37, 172-181.
5. Robertson, I. G. C., Zeiger, E. & Goldstein, J. A. (1983)
Carcinogenesis 4, 93-96.
6. Koser, P. L., Faletto, M. B., Maccubbin, A. E. & Gurtoo,
H. L. (1988) J. Biol. Chem. 263, 12584-12595.
7. Kawano, S., Kamataki, T., Maeoa, K., Kato, R., Nakao, T. &
Mizoguchi, I. (1985) Fundam. Appl. Toxicol. 5, 487-498.
8. Robertson, I. G. C., Philpot, R. M., Zeiger, E. & Wolf, C. R.
(1981) Mol. Pharmacol. 20, 662-668.
Proc. Natl. Acad. Sci. USA 87 (1990)
9. Kawajiri, K., Yonkawa, H., Harada, N., Noshiro, M., Omura,
T. & Tagershira, Y. (1980) Cancer Res. 40, 1652-1657.
10. Ishii, K., Maeda, K., Kamutaki, T. & Kato, R. (1986) Mutat.
Res. 174, 85-88.
11. Shimada, T. & Okuda, Y. (1988) Biochem. Pharmacol. 37,
459-465.
12. Metcalfe, S. A., Colley, P. J. & Neal, G. E. (1981) Chem. Biol.
Interact. 35, 145-157.
13. Wolff, T., Distlerath, L. M., Worthington, M. T., Groopman,
J. D., Hammons, G. J., Kadlubar, F. F., Prough, R. A., Martin, M. V. & Guengerich, F. P. (1985) Cancer Res. 45, 21162122.
14. Shimada, T. & Guengerich, F. P. (1989) Proc. Natl. Acad. Sci.
USA 86, 462-465.
15. Lowry, 0. H., Rosebrough, N. J., Farr, A. L. & Randall, R. J.
(1951) J. Biol. Chem. 193, 265-275.
16. Wolf, C. R. & Oesch, F. (1983) Biochem. Biophys. Res. Cornmun. 111, 505-511.
17. Wolf, C. R., Seilman, S., Oesch, F., Mayer, R. T. & Burke,
M. D. (1986) Biochem. J. 240, 27-33.
18. Wolf, C. R., Miles, J. S., Seilman, S., Burke, M. D., Rospendowski, B. N., Kelly, K. & Smith, W. E. (1988) Biochemistry
27, 1597-1603.
19. Nebert, D. W., Nelson, D. R., Adesnik, M., Coon, M. J.,
Estabrook, R. W., Gonzalez, F. J., Guengerich, F. P., Gunsalus, I. C., Johnson, E. F., Kemper, B., Levin, W., Phillips,
I. R., Sato, R. & Waterman, M. R. (1989) DNA 8, 1-14.
20. Shimada, T., Misono, K. S. & Guengerich, F. P. (1986) J. Biol.
Chem. 261, 909-921.
21. Gonzalez, F. J. (1989) Pharmacol. Rev. 40, 243-288.
22. Towbin, H., Staehelin, T. & Gordon, J. (1979) Proc. Natl.
Acad. Sci. USA 76, 4350-4354.
23. Lewis, A. D., Hickson, I. D., Robson, C. N., Harris, A. H.,
Hayes, J. D., Griffiths, S. A., Manson, M. M., Hall, A. E.,
Moss, J. E. & Wolf, C. R. (1988) Proc. Natl. Acad. Sci. USA
85, 8511-8515.
24. O'Brien, K., Moss, E. J., Judah, D. H. & Neal, G. E. (1983)
Biochem. Biophys. Res. Commun. 114, 813-821.
25. Neal, G. E., Judah, D. J., Stirpe, F. & Patterson, D. S. P.
(1981) Toxicol. Appl. Pharmacol. 58, 431-437.
26. Ames, B. N., McCann, J. & Yamasaki, E. (1975) Mutat. Res.
31, 347-364.
27. Zeiger, E., Payano, D. A. & Robertson, I. G. C. (1981) Environ. Mutagen. 3, 205-209.
28. Hall, M., Forrester, L. M., Parker, D. K., Grover, P. L. &
Wolf, C. R. (1989) Carcinogenesis 10, 1815-1821.
29. Ball, S. E., Forrester, L. M., Wolf, C. R. & Back, D. J. (1990)
Biochem. J. 267, 221-226.
30. Neal, G. E., Nielsch, U., Judah, D. J. & Hulbert, P. B. (1987)
Biochem. Pharmacol. 36, 4269-4276.
31. Ryan, D. E., Thomas, P. E., Reik, L. M. & Levin, W. (1982)
Xenobiotica 12, 727-744.
32. Elshourbagy, N. A. & Guzelian, P. S. (1980) J. Biol. Chem.
255, 1279-1285.
33. Juvonen, R. O., Shkumatov, V. M. & Lang, M. A. (1988) Eur.
J. Biochem. 171, 205-211.
34. Negishi, M., Lindberg, R., Burkhart, B., Ichikawa, T., Honkakoski, P. & Lang, M. (1989) Biochemistry 28, 4169-4172.
35. Miles, J. S., Bickmore, W., Brook, J. D., McLaren, A. W.,
Meehan, R. R. & Wolf, C. R. (1989) Nucleic Acids Res. 17,
2907-2917.
36. Ritchie, J. C. & Idle, J. R. (1982) in Host Factors in Human
Carcinogenesis, eds. Bartsch, H. & Armstrong, B. (Int.
Agency for Research on Cancer, Lyon, France), I.A.R.C. Sci.
Publ. no. 39, pp. 381-394.
�