Mark Data Made Easy
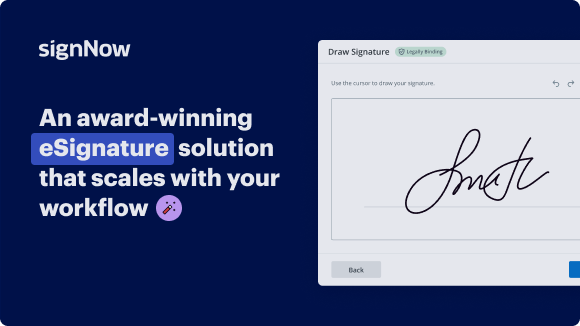
Award-winning eSignature solution


Do more on the web with a globally-trusted eSignature platform
Standout signing experience
Robust reports and analytics
Mobile eSigning in person and remotely
Industry polices and compliance
Mark data, faster than ever
Useful eSignature add-ons
See airSlate SignNow eSignatures in action


airSlate SignNow solutions for better efficiency
Our user reviews speak for themselves


Why choose airSlate SignNow
-
Free 7-day trial. Choose the plan you need and try it risk-free.
-
Honest pricing for full-featured plans. airSlate SignNow offers subscription plans with no overages or hidden fees at renewal.
-
Enterprise-grade security. airSlate SignNow helps you comply with global security standards.

Your step-by-step guide — mark data
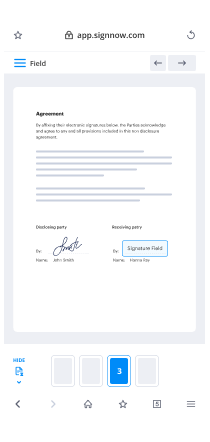
Using airSlate SignNow’s electronic signature any company can accelerate signature workflows and eSign in real-time, delivering an improved experience to clients and employees. Use mark data in a couple of simple steps. Our handheld mobile apps make work on the go achievable, even while off-line! Sign contracts from anywhere in the world and make tasks in less time.
Follow the stepwise instruction for using mark data:
- Sign in to your airSlate SignNow profile.
- Locate your record within your folders or upload a new one.
- Open up the record adjust using the Tools menu.
- Drag & drop fillable boxes, add textual content and eSign it.
- Add numerous signers using their emails and set the signing sequence.
- Choose which individuals will get an executed doc.
- Use Advanced Options to restrict access to the record and set an expiry date.
- Click on Save and Close when done.
In addition, there are more enhanced tools available for mark data. Include users to your collaborative work enviroment, browse teams, and monitor collaboration. Millions of customers all over the US and Europe recognize that a solution that brings people together in one holistic enviroment, is exactly what companies need to keep workflows functioning easily. The airSlate SignNow REST API enables you to integrate eSignatures into your application, internet site, CRM or cloud storage. Check out airSlate SignNow and enjoy quicker, smoother and overall more efficient eSignature workflows!
How it works
airSlate SignNow features that users love


See exceptional results mark data made easy
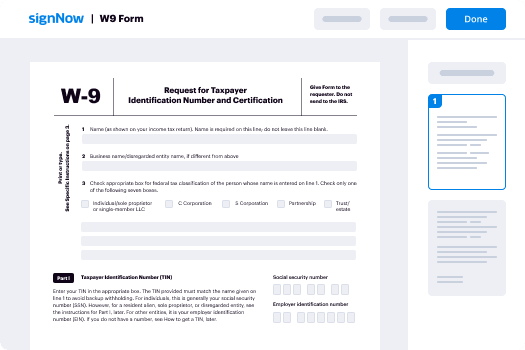
How to fill out and sign a PDF online
Try out the fastest way to mark data. Avoid paper-based workflows and manage documents right from airSlate SignNow. Complete and share your forms from the office or seamlessly work on-the-go. No installation or additional software required. All features are available online, just go to signnow.com and create your own eSignature flow.
A brief guide on how to mark data in minutes
- Create an airSlate SignNow account (if you haven’t registered yet) or log in using your Google or Facebook.
- Click Upload and select one of your documents.
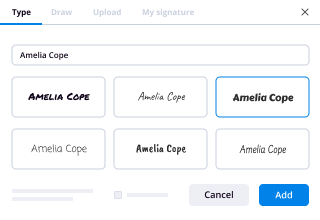
- Use the My Signature tool to create your unique signature.
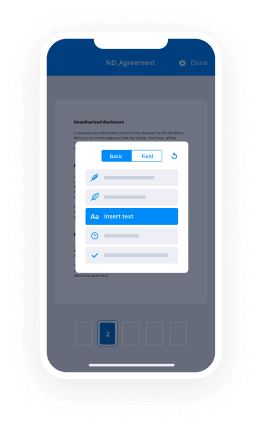
- Turn the document into a dynamic PDF with fillable fields.
- Fill out your new form and click Done.
Once finished, send an invite to sign to multiple recipients. Get an enforceable contract in minutes using any device. Explore more features for making professional PDFs; add fillable fields mark data and collaborate in teams. The eSignature solution supplies a reliable process and runs according to SOC 2 Type II Certification. Make sure that all your records are guarded and that no one can edit them.
How to eSign a PDF template in Google Chrome
Are you looking for a solution to mark data directly from Chrome? The airSlate SignNow extension for Google is here to help. Find a document and right from your browser easily open it in the editor. Add fillable fields for text and signature. Sign the PDF and share it safely according to GDPR, SOC 2 Type II Certification and more.
Using this brief how-to guide below, expand your eSignature workflow into Google and mark data:
- Go to the Chrome web store and find the airSlate SignNow extension.
- Click Add to Chrome.
- Log in to your account or register a new one.
- Upload a document and click Open in airSlate SignNow.
- Modify the document.
- Sign the PDF using the My Signature tool.
- Click Done to save your edits.
- Invite other participants to sign by clicking Invite to Sign and selecting their emails/names.
Create a signature that’s built in to your workflow to mark data and get PDFs eSigned in minutes. Say goodbye to the piles of papers sitting on your workplace and begin saving time and money for extra crucial duties. Picking out the airSlate SignNow Google extension is a great handy option with lots of benefits.
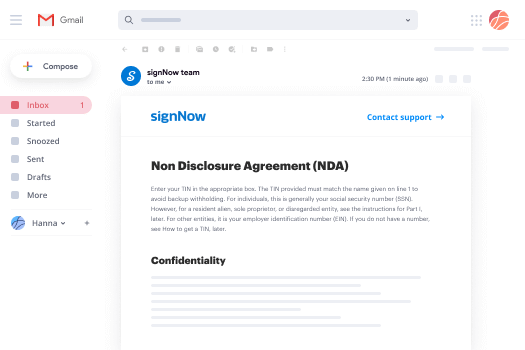
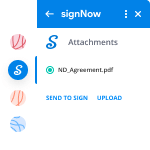

How to eSign an attachment in Gmail
If you’re like most, you’re used to downloading the attachments you get, printing them out and then signing them, right? Well, we have good news for you. Signing documents in your inbox just got a lot easier. The airSlate SignNow add-on for Gmail allows you to mark data without leaving your mailbox. Do everything you need; add fillable fields and send signing requests in clicks.
How to mark data in Gmail:
- Find airSlate SignNow for Gmail in the G Suite Marketplace and click Install.
- Log in to your airSlate SignNow account or create a new one.
- Open up your email with the PDF you need to sign.
- Click Upload to save the document to your airSlate SignNow account.
- Click Open document to open the editor.
- Sign the PDF using My Signature.
- Send a signing request to the other participants with the Send to Sign button.
- Enter their email and press OK.
As a result, the other participants will receive notifications telling them to sign the document. No need to download the PDF file over and over again, just mark data in clicks. This add-one is suitable for those who like focusing on more valuable tasks as an alternative to burning up time for practically nothing. Increase your daily compulsory labour with the award-winning eSignature solution.
How to eSign a PDF on the go without an mobile app
For many products, getting deals done on the go means installing an app on your phone. We’re happy to say at airSlate SignNow we’ve made singing on the go faster and easier by eliminating the need for a mobile app. To eSign, open your browser (any mobile browser) and get direct access to airSlate SignNow and all its powerful eSignature tools. Edit docs, mark data and more. No installation or additional software required. Close your deal from anywhere.
Take a look at our step-by-step instructions that teach you how to mark data.
- Open your browser and go to signnow.com.
- Log in or register a new account.
- Upload or open the document you want to edit.
- Add fillable fields for text, signature and date.
- Draw, type or upload your signature.
- Click Save and Close.
- Click Invite to Sign and enter a recipient’s email if you need others to sign the PDF.
Working on mobile is no different than on a desktop: create a reusable template, mark data and manage the flow as you would normally. In a couple of clicks, get an enforceable contract that you can download to your device and send to others. Yet, if you want a software, download the airSlate SignNow app. It’s comfortable, fast and has a great interface. Experience easy eSignature workflows from your workplace, in a taxi or on a plane.
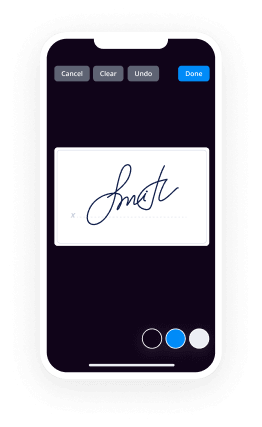
How to sign a PDF using an iPhone
iOS is a very popular operating system packed with native tools. It allows you to sign and edit PDFs using Preview without any additional software. However, as great as Apple’s solution is, it doesn't provide any automation. Enhance your iPhone’s capabilities by taking advantage of the airSlate SignNow app. Utilize your iPhone or iPad to mark data and more. Introduce eSignature automation to your mobile workflow.
Signing on an iPhone has never been easier:
- Find the airSlate SignNow app in the AppStore and install it.
- Create a new account or log in with your Facebook or Google.
- Click Plus and upload the PDF file you want to sign.
- Tap on the document where you want to insert your signature.
- Explore other features: add fillable fields or mark data.
- Use the Save button to apply the changes.
- Share your documents via email or a singing link.
Make a professional PDFs right from your airSlate SignNow app. Get the most out of your time and work from anywhere; at home, in the office, on a bus or plane, and even at the beach. Manage an entire record workflow effortlessly: create reusable templates, mark data and work on documents with business partners. Turn your device right into a potent organization tool for closing contracts.
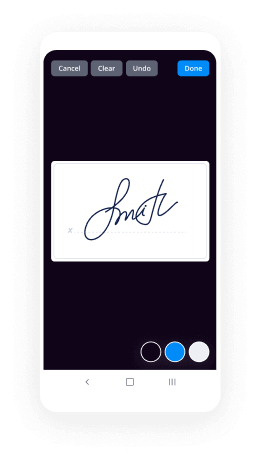
How to sign a PDF taking advantage of an Android
For Android users to manage documents from their phone, they have to install additional software. The Play Market is vast and plump with options, so finding a good application isn’t too hard if you have time to browse through hundreds of apps. To save time and prevent frustration, we suggest airSlate SignNow for Android. Store and edit documents, create signing roles, and even mark data.
The 9 simple steps to optimizing your mobile workflow:
- Open the app.
- Log in using your Facebook or Google accounts or register if you haven’t authorized already.
- Click on + to add a new document using your camera, internal or cloud storages.
- Tap anywhere on your PDF and insert your eSignature.
- Click OK to confirm and sign.
- Try more editing features; add images, mark data, create a reusable template, etc.
- Click Save to apply changes once you finish.
- Download the PDF or share it via email.
- Use the Invite to sign function if you want to set & send a signing order to recipients.
Turn the mundane and routine into easy and smooth with the airSlate SignNow app for Android. Sign and send documents for signature from any place you’re connected to the internet. Build good-looking PDFs and mark data with just a few clicks. Assembled a faultless eSignature workflow with only your mobile phone and boost your overall productiveness.
Get legally-binding signatures now!
FAQs
-
How do you label data points in Excel?
Add data labels to a chart To label one data point, after clicking the series, click that data point. > Data Labels. To change the location, click the arrow, and choose an option. If you want to show your data label inside a text bubble shape, click Data Callout. -
How do you specify data labels in Excel?
Suggested clip Excel 2016 Tutorial Formatting Data Labels Microsoft Training ...YouTubeStart of suggested clipEnd of suggested clip Excel 2016 Tutorial Formatting Data Labels Microsoft Training ... -
How do I change the order of data labels in Excel?
Under Chart Tools, on the Design tab, in the Data group, click Select Data. In the Select Data Source dialog box, in the Legend Entries (Series) box, click the data series that you want to change the order of. Click the Move Up or Move Down arrows to move the data series to the position that you want. -
How do you add a name to a data point in Excel?
Suggested clip Create an X Y Scatter Chart with Data Labels - YouTubeYouTubeStart of suggested clipEnd of suggested clip Create an X Y Scatter Chart with Data Labels - YouTube -
How do you add a name to a scatter plot in Excel?
Select cell range B3:C11. Go to tab "Insert" Click the "scatter" button. Right click on a chart dot and left click on "Add Data Labels" Right click on a dot again and left click "Format Data Labels" A new window appears to the right, deselect X and Y Value. -
Can you add two data labels in Excel chart?
Right click the data series in the chart, and select Add Data Labels > Add Data Labels from the context menu to add data labels. 2. Click any data label to select all data labels, and then click the specified data label to select it only in the chart. -
How do I select data for a chart in Excel?
Suggested clip Selecting Data in Different Columns for an Excel Chart - YouTubeYouTubeStart of suggested clipEnd of suggested clip Selecting Data in Different Columns for an Excel Chart - YouTube -
How can you determine which cell data is being used in a chart in Excel?
If your chart data is in a continuous range of cells, select any cell in that range. Your chart will include all the data in the range. If your data isn't in a continuous range, select nonadjacent cells or ranges. Just make sure your selection forms a rectangle. -
How do I graph data in Excel?
Suggested clip How to create a chart in Excel - YouTubeYouTubeStart of suggested clipEnd of suggested clip How to create a chart in Excel - YouTube -
How do you insert a graph in Excel?
On the View menu, click Print Layout. Click the Insert tab, and then click the arrow next to Chart. Click a chart type, and then double-click the chart you want to add. ... In Excel, replace the sample data with the data that you want to plot in the chart. -
How do I select specific data in Excel?
Click any cell in the data range. ... Press [F5]. In the Go To dialog, click the Special button in the bottom-left corner. In the resulting dialog, click the Current Region option. Click OK, and Excel will select the current data range (the current region). -
How do I select data in Excel?
Suggested clip Excel select data - YouTubeYouTubeStart of suggested clipEnd of suggested clip Excel select data - YouTube -
How do I select a lot of data in Excel?
Suggested clip Select large amounts of data in Excel - YouTubeYouTubeStart of suggested clipEnd of suggested clip Select large amounts of data in Excel - YouTube -
How do you select data for a graph in PowerPoint?
On the slide, select the chart that you want to change. The Chart Tools contextual tab appears at the top of the PowerPoint window. ... Under Chart Tools, on the Design tab, in the Data group, click Edit Data. Done one of the following: ... Make the changes you want. -
How do you automatically update Excel charts in PowerPoint?
Open Excel file. Select table and insert chart via Insert. Copy chart to clipboard. Open PowerPoint file. Click Paste via the Home ribbon. Select the option Match Destination Formatting. Select chart. In Draft execute the function Update data.
What active users are saying — mark data


Related searches to mark data made easy

Mark data
futures radio show sponsored by CME Group the world's leading and most diverse futures and options exchange semigroups markets help individuals and businesses around the world effectively manage risk for access to free educational tools and resources for the active individual trader please visit active trader dot CME Group comm every day traders and investors dive in to tackle the ever-changing markets to find opportunity futures radio show is your number one source for answers to the questions that all market participants want to ask veteran futures trader Anthony crude deli sits down with the most influential leaders and top traders in the industry here's your host Anthony crew deli hey everybody thanks for tuning in for this episode with Marc Heriberto remember new shows are posted on Mondays and Thursdays you could subscribe to the show on iTunes and YouTube if you're enjoying the show please leave a review on iTunes before I played today's interview for you I want to give a shout out to the great sponsors of futures radio show see me Group trading technologies rjo futures and tap step trader to learn more about these sponsors and the important things they are doing for futures traders be sure to click on their logos on our website today I spoke with the CEO of bar chart Marc Heriberto we chatted about bar chart and data for commodities trading Marc explains how they've taken proprietary data and turned it into indices we discussed bar charts latest ads on their platform commodity view and he tells us about an upcoming live event that bar chart is hosting for commodities traders so without further ado let me take you right to the interview with Marc I know today we're gonna talk a lot about what it is that you guys are currently doing at bar chart the traders should take a look at but man the history I have with you guys go so hold me back to the beginning of my career I remember getting online and searching for futures markets very few things came up but you guys did so you have been a great resource for me for many many years over 20 years so before we get into what it is that you guys are currently doing some new ads that you have at bar chart tell everybody that out there that doesn't know what bar chart is what it is that you guys do yes sounds good sounds good so if you're not familiar with us I mean bar charts been online you know we started in 1995 as one of the first websites for futures and commodities data and it started as a subscription product and we've evolved since 1995 into a full-fledged data and technology company that has really to two distinct arms one is media and that's bar chart comm which is free for traders and investors and other market participants to use and we cover equities and futures and options and ETFs and currencies and crypto both through free access to the website as well as free registered access where you get more tools and more data and then we have a subscription-based service to bar chart comm called bar chart premier where you get even more data more tools to help make trading and investing decisions and then the other distinct arm is our solutions business where we provide solutions to businesses in all those sectors and being a Chicago based company and starting in Chicago our bread and butter is is commodities and within commodities we've always done a lot within agriculture yeah following you guys over the years I've always noticed that you've had a really strong focus on the AG space and as of late I know that you guys have added some things that you're really excited about specific for grain traders talk to us about what you've recently added yeah yeah thanks so we've had a lot of different products for the AG and grain industry you know ranging from grain buyers to farmers to grain traders and speculators and analysts and brokers really the whole mix and those products have been offered through three different product groupings of bar chart one being bar chart the other we bought in 2001 commodity Research Bureau which has been around since 1934 CRB for short has always had its own suite of products and then about ten years ago we launched a brand called Agri charts which we branded to go a little bit more direct to grain elevators and the institutional space in grain starting with things like web hosting and content things like quotes and charts and news for grain elevator websites that has it has been fine for many years but as we have started to grow within the space and really offer more we needed to tie those three pieces back together in a unified suite of products the key thing we've been trying to do is one you know bar chart that's our company everything is underneath bar chart we don't have other divisions and that may have been confusing to some folks for a long time and we really focused on establishing bar chart as the brand with product Suites underneath it and for the commodity space what we've what we did in the fall 2007 we launched a brand a new brand called commodity spelled CMD t y so the abbreviation for commodity and we've pulled all of our commodity products underneath that brand mainly our AG brand and egg products were which were Agri charts and CRB that those products are all now under CMD T Y which is really a collection of data products and tools and software that are offered to commodity professionals and institutional commodity clients and this range is everything from everything from exchange price data to cash market data for grain to Newswires that we offer to the grain industry we offer physical a physical trading platform for for grain we and then we wrap all these things up into a platform called commodity view so really it's it's it's a specialized product grouping right now all targeting the grain sector one thing that you currently did was you took proprietary data that you turned into indexes explain that everybody please yeah so a big part of the commodity suite of products is focused on establishing new sets of data that are proprietary and one thing we've been doing for a long time is offering access to physical grain markets grain elevator cash prices and basis and we've offered that you know through different tools like our software and API is where you could look up local grain markets by zip code we've now taken that data and we've aggregated that data and you're talking about tens of thousands of different pricing points there's thousands of different grain buy and locations across the u.s. well as a whole you know that's a lot to look at so we've distilled bet down into these new indexes they're they're labeled C mdty indexes and in this case they're specific to grain we now calculate geographically based cash price and basis indexes for corn soybeans and wheat so one example would be take the state of Iowa we look at each county within Iowa and we calculate a benchmark index for each County we also do that for the basis within each County so if you wanted to know right now what is the the average basis or the average cash price for Boone County Iowa we calculate that for you but it's not just an average we actually enhance it because our methodology weights the index by the size or the throughput of each grain buying facility so that's the smart factor that we employ within the index methodology we then roll those calculations up so you could look at county by county and then you could compare counties why is the base is higher in this county versus vet County that to us is market intelligence that's very useful and valuable and then you could roll it up so we roll up those counties into regions state and nation so you could start doing um even larger types of analysis so you know these indexes this is kind of a new thing for the grain sector what we're trying to establish here is really a fair value calculation or in other words a a pricing benchmark for specific geographic region and that has led us to conduct a study on the usefulness of these indexes they're useful from you know one knowing what an aggregated area looks like just from a display a perspective you know we we put these prices the maps and the heat map so you can easily compare one County to another and for a grain buyer or seller that's really helpful in identifying where prices are higher or lower or basis as high or lower but there's more that can be done with the data so we put together a white paper that we just released last week which puts the data through more of a economic analysis or just just just the economic or academic sorry analysis and the conclusions we come up with sent around using our basis indexes for identifying seasonality patterns within different regions and then comparing current levels to that seasonality to know if prices or basis is stronger week that's a very strong conclusion that we've been able to draw from using our indexes and then second is part of the white paper is we've shown how the indexes can be used to predict future basis three months out and that can become a very effective tool to grain buyers grain sellers speculators for taking a forward look at what basis values might be using our underlying data I have to say I am really impressed on how hyper focused you guys are on the geographical locations mm-hmm but how much demand is there from clients for you guys to create this sure sure so you know number one this is a new this is a new thing I mean a lot of people probably have been you know people look at seasonality and keep historical logs in notebooks and spreadsheets but really what we're doing I mean this is a new thing and to get traction and to look at grain prices in this way it's not a short-term thing to take a lot of time it's going to take white papers like this it's going to take marketing it's going to take exposure but there's a lot of potential people and firms that could use this type of data it ranges from of course grain buyers you know elevators and processors of grain of course grain producers like farmers but then there's a whole slew of others ranging from AG lenders and banks to crop insurance providers folks that transport grain freight and barge they're looking at differences in geographic pricing to trading houses and food companies so there's really there's a grain I mean it's it's a huge huge huge marketplace with a lot of different types of individuals and firms that touch it so we think there's potential because of that but still to establish a new concept is it's a long-term initiative now and how we look at that is you know we offer many tools that are essential and they're you know things like data and charts and news and weather but what these indexes and other new data sets were releasing we're establishing those because we think they have value and also because we want to distinguish ourselves from the competition and these types of data and then else's you could do with them is is is what's going to make that possible hey everyone I hope you're enjoying the show so far but I want to pause and think one of our sponsors trading technologies I started using tt in the year 2000 and I loved it it is by far the best trading platform I have ever used and I've tried a lot of them with titi you can treat the global markets from virtually anywhere in the world they are the world's fastest commercially available futures trading platform I highly suggest you go try OTT especially because you can try it for free just go to try tt now.com and set up your account I want to talk about commodity view and that's your platform it's a subscription-based data and market analysis platform once again heavily focused on grain trading and I know that you guys are launching or have launched a few new pieces calling it 2.0 discuss with us what you are launching and why traders should be taking a look at this sure so if you look at the commodity suite of products you've got we've got the data exchange data we've got proprietary data we have news wires we have fundamental commodity data things like USDA production and consumption data we've got Futures Trading we have cash trading features most of those things are available individually as well as via API they also all roll up into our flagship platform commodity view and you could view all those pieces of information within commodity view you can use all of our trading functionality within commodity view and we're excited to say we're launching version 2.0 of commodity view and it has everything from an updated user interface to integration of many new data sets and also integration of software that's been disjointed from commodity view in the past so we have a platform named commodity match which is a physical grain trading platform well for a long time that platform was a standalone on its own we've now integrated that within commodity view so you don't have to operate two platforms on the heels of that we've also we also launching something called my TWU Excel where all this data and tools all the data and tools can be used within Excel giving users more flexibility and freedom and a few other things actually this is a big one new charting an entirely new charting interface within commodity view which were super excited about and then a handful of other user interface usability features user experience features making this a really big release for us so we're putting a we're putting a lot of customer training and a lot of marketing in front of this and we're really excited to get this out there ya know it is exciting and something else that you guys are doing coming up in May in Chicago you're hosting an event called commodity exchange and this is going to be a big deal for the for the AG community it's your first year doing this give all of us the details of this event yeah so commodity exchange our first year hosting this event May 8th a detent in Chicago it is you know we like bringing communities together and we think that's important for the industry so commodity exchange is doing just that for the grain industry it's bringing together grain buyers grain sellers people who offer data and technology within the grain space and there's so many new technologies from things like satellite imagery to artificial intelligence and precision farming and and big data that you know these technologies are changing the landscape of of the commodity markets new data sets like some of the mentioned are changing how things are being analyzed there's all sorts of new farm management tools coming out so we're putting together this event to bring all those things together talk about the technology and the data change in the landscape of of the grain markets and we've got institutional firms we have traders we have exchanges participating in this there's going to be a host of network out working opportunities a great lineup of panels talking about everything from ones called the new harvest AG data all the types of new data being harvested within AG and others talking about physical grain trading and the digital platforms being offered within that space and how those are evolving and others talking about innovations in grain transportation and how that's changing so really you know we're bringing together a wide variety of firms and people that are involved in the grain markets to talk about how it's changing and it's the first year for it may 8th to 10th in Chicago we can't we couldn't think of a better time or place to host such event so I'll check it out it's commodity that's C mdty exchange comm and you can see the full agenda full line of speakers and firms that are involved yeah I love that you guys are doing these live events I've attended your live events in the past actually hosted one of them and you guys just do a fantastic job of bringing traders together because once again this is a people's business and we forget about that when it's online so it's great to see people like you bar chart putting together these these great events for traders to get together and to actually talk in person yeah work at people find you guys on Twitter and give us a website to check out yes so you can find us at bar chart on Twitter and then in general you know bar chart com that's our flagship you know free financial portal data tools market analysis but you know if you have an interest more in institutional side of the business especially is say the grain side of the business take a look at SEM dty datacom commodity datacom and you could see many more details on what bar chart is offering through our commodity suite of products Marc thank you again for coming out futures radio show Anthony thanks for having me again I appreciate it thank you for listening to futures radio show if you have any questions or comments for myself or my guests please visit futures radio show comm and sign up to be a Premium Member for free if you enjoy the show don't forget to leave us a review on iTunes
Show moreFrequently asked questions
What is the definition of an electronic signature according to the ESIGN Act?
How can I make an electronic signature on a PC?
Can I create a doc and add an electronic signature?
Get more for mark data made easy
- Type signature
- Prove electronically signed Incentive Plan
- Endorse digisign document
- Authorize signature service Camp Trip Planning
- Anneal mark iOS App Development Proposal Template
- Justify esign SEO Agreement Template
- Try countersign Construction Contract
- Add Retention Agreement electronically sign
- Send Simple Sales Proposal Template countersignature
- Fax Quinceañera Invitation digital signature
- Seal Summer Camp Emergency Contact signed
- Password Software Development Proposal Template digi-sign
- Pass Affidavit of Title esign
- Renew Boarding and Daycare Contract initial
- Test Patient Intake Form signature
- Require Non-Disclosure Agreement Template email signature
- Comment bystander digital sign
- Boost proof autograph
- Call for recipient eSignature
- Void Book Publishing Contract Template template electronically signing
- Adopt Hedging Agreement template mark
- Vouch Translation Quote template signed
- Establish Work for Hire Agreement template autograph
- Clear Startup Business Plan Template template digital sign
- Complete Travel Plan template initial
- Force Acknowledgement Letter Template template signed electronically
- Permit Rent Receipt template electronically sign
- Customize Affidavit of Title template countersignature